 Eden
Eden
Eden Environmental Compliance Platform
A hands-on guide to using Eden as a regulated company — setting up your profile, entering monitoring data, filing your returns, and understanding the grade you are given. Last updated October 2026.
Welcome to Eden
Eden is an environmental compliance platform for industry and for the agencies that regulate it. Regulated companies record their monitoring data, submit their periodic returns, undergo audits and stay accountable to their permit conditions. Their national regulator reviews those returns, audits them, and sets the rules they are judged against. The Sustainability Suite extends this to carbon, ESG, health & safety, risk and multi-country compliance, and Eden can be installed as an app on any device.
One platform, one country's rules at a time
Eden is not written for any one country's law. Each national environmental agency configures its own: its statutes, its permitted levels, the questions its officers score on site, the month its reporting year begins, and the currency its penalties are quoted in. Those rules govern that country's companies and nobody else's, and no agency can read or change another's.
The first agency to run on Eden was the Environmental Protection Agency in Ghana, and it is still the reference deployment. Where this manual names a country, it is as an example: the platform ships with several configured, and adding another does not need a line of code.
This manual is structured by user role. Jump to the section that matches what you do day-to-day, or read it end-to-end if you're new.
Getting Started
1. Receiving Your Account
If you're a company representative, your account is created either:
- By requesting access through the public landing page (Pricing → Request Account), then waiting for EPA approval; OR
- By an EPA Administrator who registered your company directly.
When your account is approved you receive an email with your username and a link to choose your password. The link works once and for three days; if it has expired, use Forgot your password? on the sign-in page to get a fresh one. Eden never sends a password by email. If an administrator created your account and gave you a first password instead, Eden asks you to choose your own the first time you sign in.
2. Logging In
- Visit the login pageOpen the Eden URL provided to you and click "Sign In" (top-right of the landing page).
- Enter your credentialsYour username and the password you chose. Both are case-sensitive.
- Enter your code, if askedWith two-factor sign-in on, Eden then asks for the 6-digit code from your authenticator app.
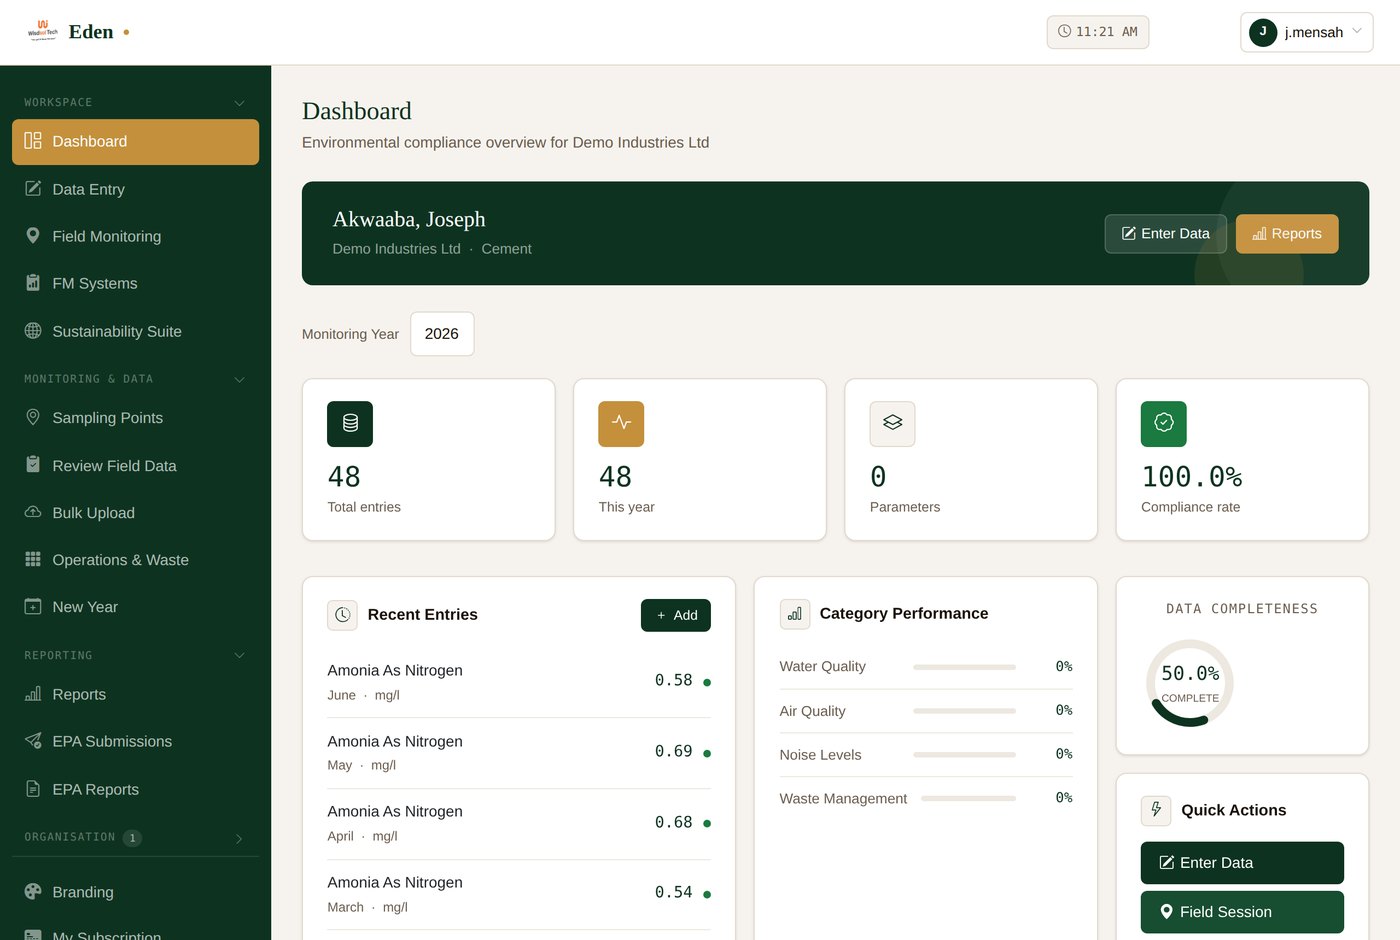
- Watch for the welcome bannerA green banner at the top confirms you're logged in and identifies your role.
3. Changing Your Password
Open your avatar in the top-right corner → Change Password. Choose at least 12 characters — a short sentence of unrelated words is easier to remember than a jumble of symbols, and just as strong.
Three wrong passwords hold sign-in for 15 minutes, important accounts must use two-factor sign-in, and a sign-in ends after 30 minutes without activity. All of it is explained in Signing In and Keeping Your Account Safe.
Installing the Eden App
Eden can be installed on your phone, tablet or computer like an ordinary app. It opens in its own window from your home screen or desktop, starts faster, and keeps itself up to date. No app store is involved and nothing extra is charged.
Android phones and tablets
- Open Eden in ChromeSamsung Internet and Edge work too.
- Tap Install EdenThe button appears at the bottom-right of the screen, or open the browser menu ⋮ and choose Install app.
- ConfirmEden appears in your app drawer and on your home screen.
iPhone and iPad
- Open Eden in SafariApple only allows installing from Safari.
- Tap the Share buttonThe square with an arrow pointing up, in the toolbar.
- Choose Add to Home Screen, then AddTapping Install Eden in the app shows these same steps on screen.
Windows, Mac, Linux and Chromebook
In Chrome or Edge, click the install icon at the right-hand end of the address bar, or choose Install app from your user menu (top-right) inside Eden. On a Mac using Safari, choose File → Add to Dock.
Finding Your Way: the Sidebar
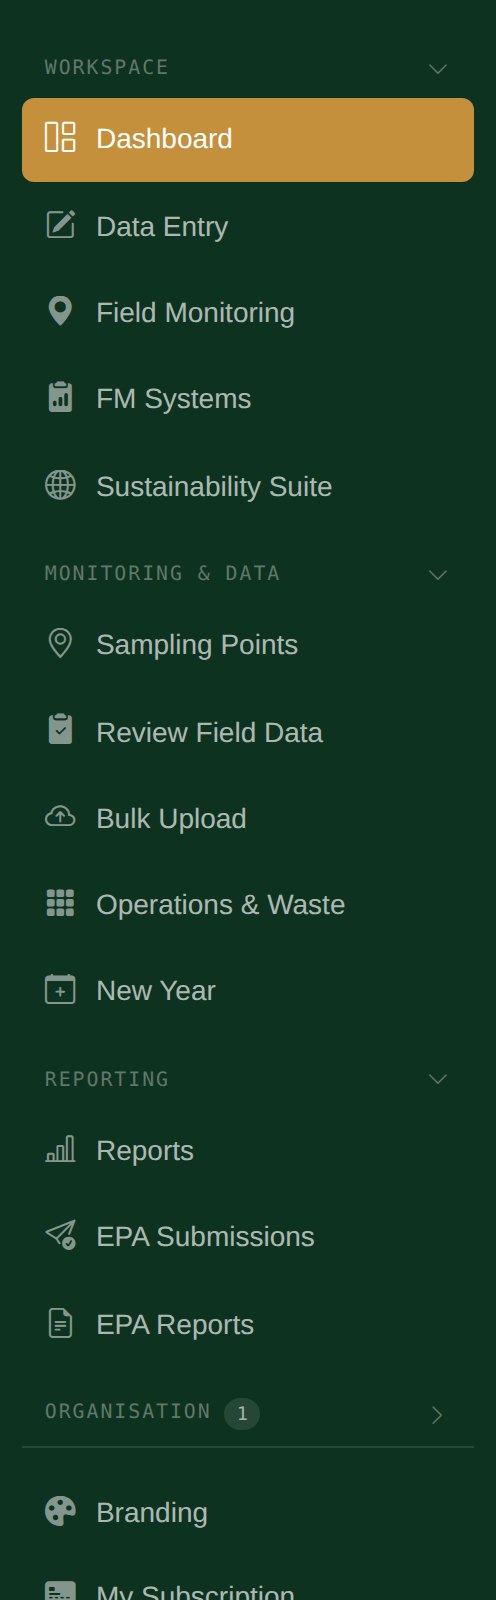
Eden has two sidebars, because it is really two things: the monitoring system a company files its returns through, and the sustainability suite it manages everything else in. The Sustainability Suite link moves you between them.
The monitoring sidebar
Grouped into Workspace, Monitoring & data, Reporting and Organisation. Which sections you see depends on your role.
The suite sidebar
The suite holds every module your organisation has switched on — from places & indicators and compliance to biodiversity, water, projects and the assistant (see Choosing Your Modules). The switcher at the top of the sidebar moves between them, and beneath it every module follows the same three-part shape:
| Part | What is in it |
|---|---|
| The module's own pages | Its overview and its working screens, ordered from what you open daily to what you consult occasionally. The first is always Overview. |
| Working groups | The records behind those pages, grouped by subject — Safety, Chemicals, Health, Contractors, and so on. |
| Reference | Always the last group. Lookup tables — emission factors, frameworks, units, device types — that are set up once and rarely touched. |
Every screen appears in one place only. Where a page and a records table cover the same thing — incidents, devices, risks — the sidebar lists the page, because it filters and summarises; its header carries a link to the full table for adding and editing. So if you are looking for "all incidents", open Incidents and use All records in the header rather than hunting for a second menu entry.
Working with the sidebar
- Fold a section by clicking its heading. A folded section shows how many links it contains. Eden remembers your choice on this device.
- The section containing the page you are on always stays open. If it is folded, an amber dot marks it.
- Collapse the whole sidebar to icons with the Collapse button at the bottom, or press
[. Hover over an icon to see its name. Press[again, or click Expand, to bring the labels back.
Go to: any screen by name
The sidebar shows one module at a time. To reach a screen in another, press Go to… on the top bar, or press / anywhere (Ctrl K also works), and type part of its name — permits, water, surveys. It searches every module your organisation has switched on, plus your own menu. Use the arrow keys and Enter, or click. With nothing typed it lists the screens you opened recently and the front page of each module.
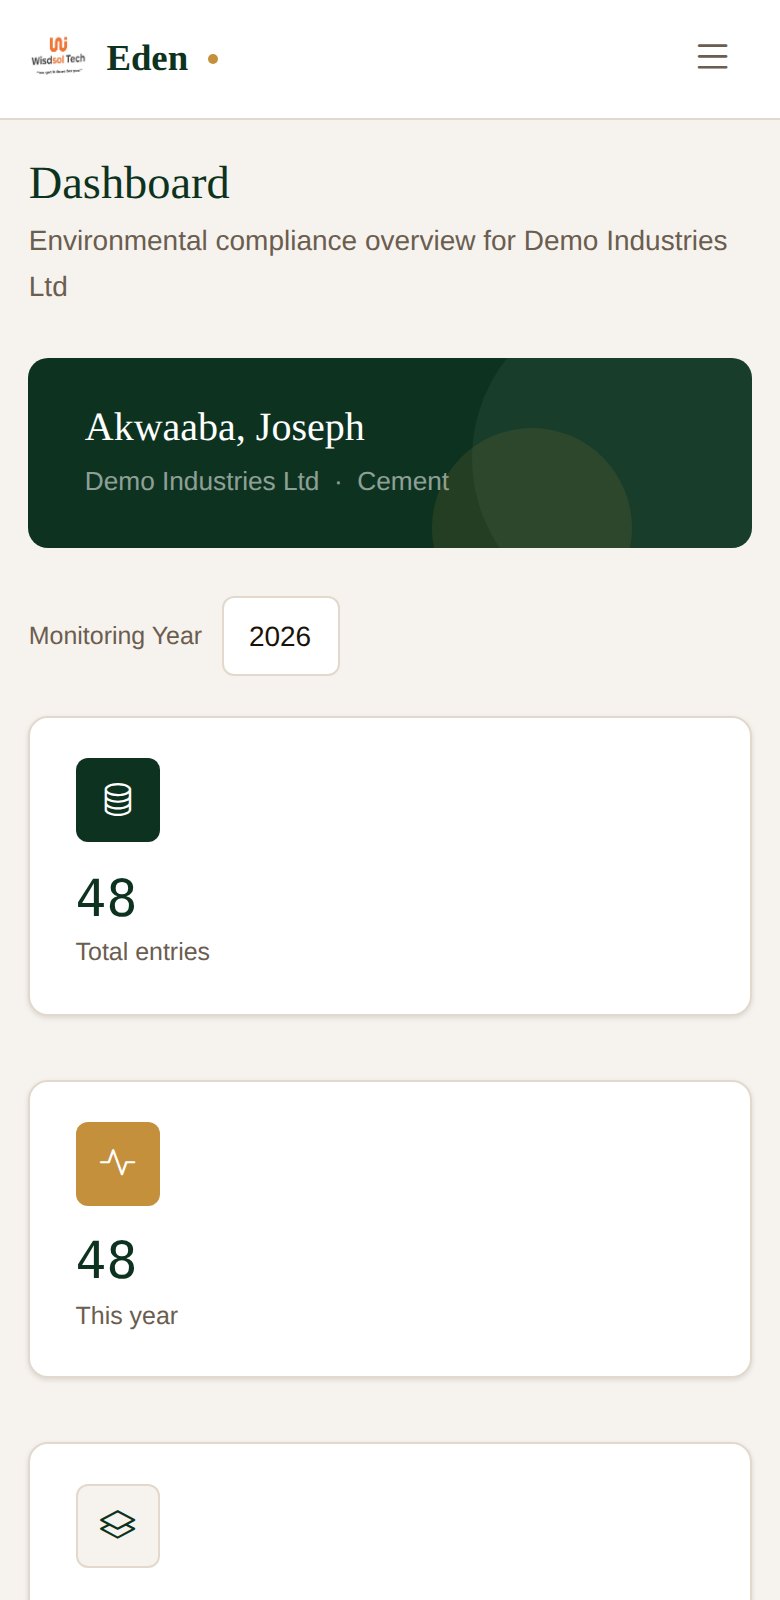
On a phone
On phones and small tablets the sidebar folds away and a bar along the bottom of the screen holds the four places people go most: Home, Modules, Go to and Menu, which slides in the full sidebar. On a record's page, the link above its title goes one level up — from a sighting to its survey, from a survey to the list of surveys. Tables too wide for the screen scroll sideways inside their card, and section tabs scroll as one row.
Light and dark mode
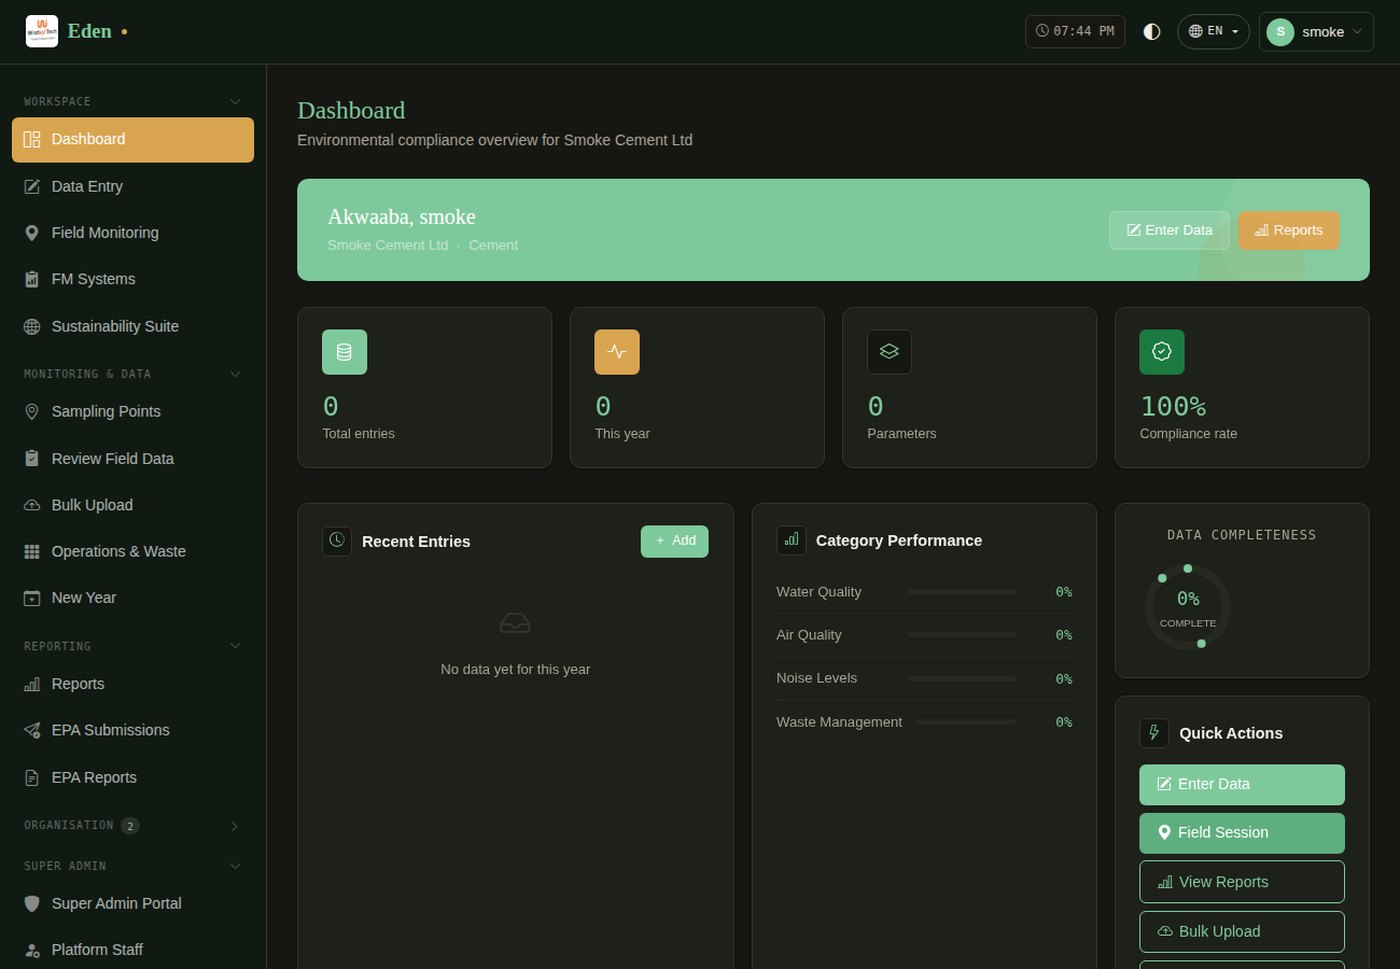
The circle icon at the top of the screen switches Eden's appearance. It cycles through three settings: follow my device, light and dark. Your choice is saved to your account, so it follows you to any computer or phone you sign in on.
- Follow my device is the default: Eden matches whatever your phone or computer is set to, including switching automatically at night if your device does.
- Dark mode is easier on the eyes in a dim control room or at night; light mode is clearer in bright sunlight on site.
- Printed reports and PDFs always come out on a white background, whichever mode you use.
Signing In and Keeping Your Account Safe Company Regulator
Eden holds permits, monitoring results, audit findings and payment records. Most of what protects them happens without you noticing; this chapter covers the parts you will see. Everything here is on one page: your avatar → Security & sign-in.
Your first password
New accounts receive an email with a link to choose their own password. The link works once and for three days. If it has expired, open the sign-in page, click Forgot your password? and enter your email address: a fresh link arrives within a minute. If an administrator gave you a first password instead, Eden asks you to choose your own before you can do anything else.
A password must be at least 12 characters, and cannot be a common password, numbers only, or too like your username. A short sentence of unrelated words — green ledger harbour sunrise — is both strong and easy to remember.
Wrong passwords
After two wrong passwords the sign-in page warns how many tries are left. After the third, sign-in to that account is held for 15 minutes — even the right password is refused until then, so that nobody can keep guessing. Two ways out:
- wait until the time on the page has passed, or
- click Forgot your password? and set a new one. A new password lifts the hold at once.
The same applies to two-factor codes: three wrong codes hold the account in the same way.
Two-factor sign-in
With two-factor sign-in on, Eden asks for a 6-digit code from an app on your phone after your password. Someone who learns your password still cannot sign in without your phone. It is required for Eden's own administrators and for regulator administrators, and Eden asks them to set it up at their next sign-in. Everyone else can switch it on, and we recommend it.
- Install an authenticator appGoogle Authenticator, Microsoft Authenticator, Authy or 1Password. They are free.
- Open Security & sign-in → Set up two-factor sign-inEden shows a QR code, and the same key as text for apps that cannot scan.
- Scan the code with the appThe app starts showing a 6-digit code for Eden that changes every 30 seconds.
- Type the current code and click Switch onIf it is refused, check that your phone sets its time automatically and use the newest code.
- Save your ten backup codesThey are shown once. Each signs you in once instead of an app code — print them or keep them in a password manager, not on the same phone.
New phone? On the security page choose Move to a new phone and scan the new code with the new phone. Running low on backup codes? Enter a current code and choose Get new backup codes; the old ones stop working. Lost your phone and your codes? Ask your platform administrator to reset your two-factor sign-in; you set it up again at your next sign-in.
How long you stay signed in
- A sign-in ends after 30 minutes without activity, and in any case 12 hours after you signed in. Unsaved typing on an open form is lost, so save as you go.
- Sign out everywhere else (on the security page) signs out every other phone and computer signed in to your account at once, and keeps the one you are using. Use it after signing in on a shared or lost device.
User Roles in Eden
Your dashboard, sidebar menu and what you can open all depend on your role. These are the ones you will meet:
| Role | Who it is |
|---|---|
| Company | Your own account. Enters monitoring data, prepares submissions to the regulator, and downloads your receipts, reports and certificate. |
| Team Member | A colleague you invite. Can do what the role you assign them allows — enter data, view reports, submit to the regulator. See Workspaces & Teams. |
| Consultant | An environmental firm working on your behalf, with its own team. They see only the companies that have engaged them. |
| EPA Staff | An officer at your regulator. Reviews what you submit, conducts your audits, and writes the feedback you receive. |
| EPA Admin | Runs your regulator’s side of Eden: its officers, the companies on its register, and the rules your country is judged against. |
Workspaces, Teams & Data Privacy
Each subscriber works in a private workspace. Your monitoring data, submissions, reports and suite records are visible only to:
- You, the account owner;
- Your team members — colleagues you invite, with the permissions of the role you assign them (see Team Members in the sidebar);
- Your appointed consultant, if you work with an environmental firm through Eden;
- EPA regulators in the course of their oversight — they review your submissions and compliance records.
No other subscriber can see your data, even by guessing a web address. Every page checks who you are before showing a record.
Inviting your team
- Open Team MembersIn the Organisation section of the sidebar.
- Create or choose a roleRoles decide what a member can do — enter data, view reports, submit to the EPA, manage members, and so on.
- Send an invite linkThe person joins with their own login. Never share your own password.
Your workspace page
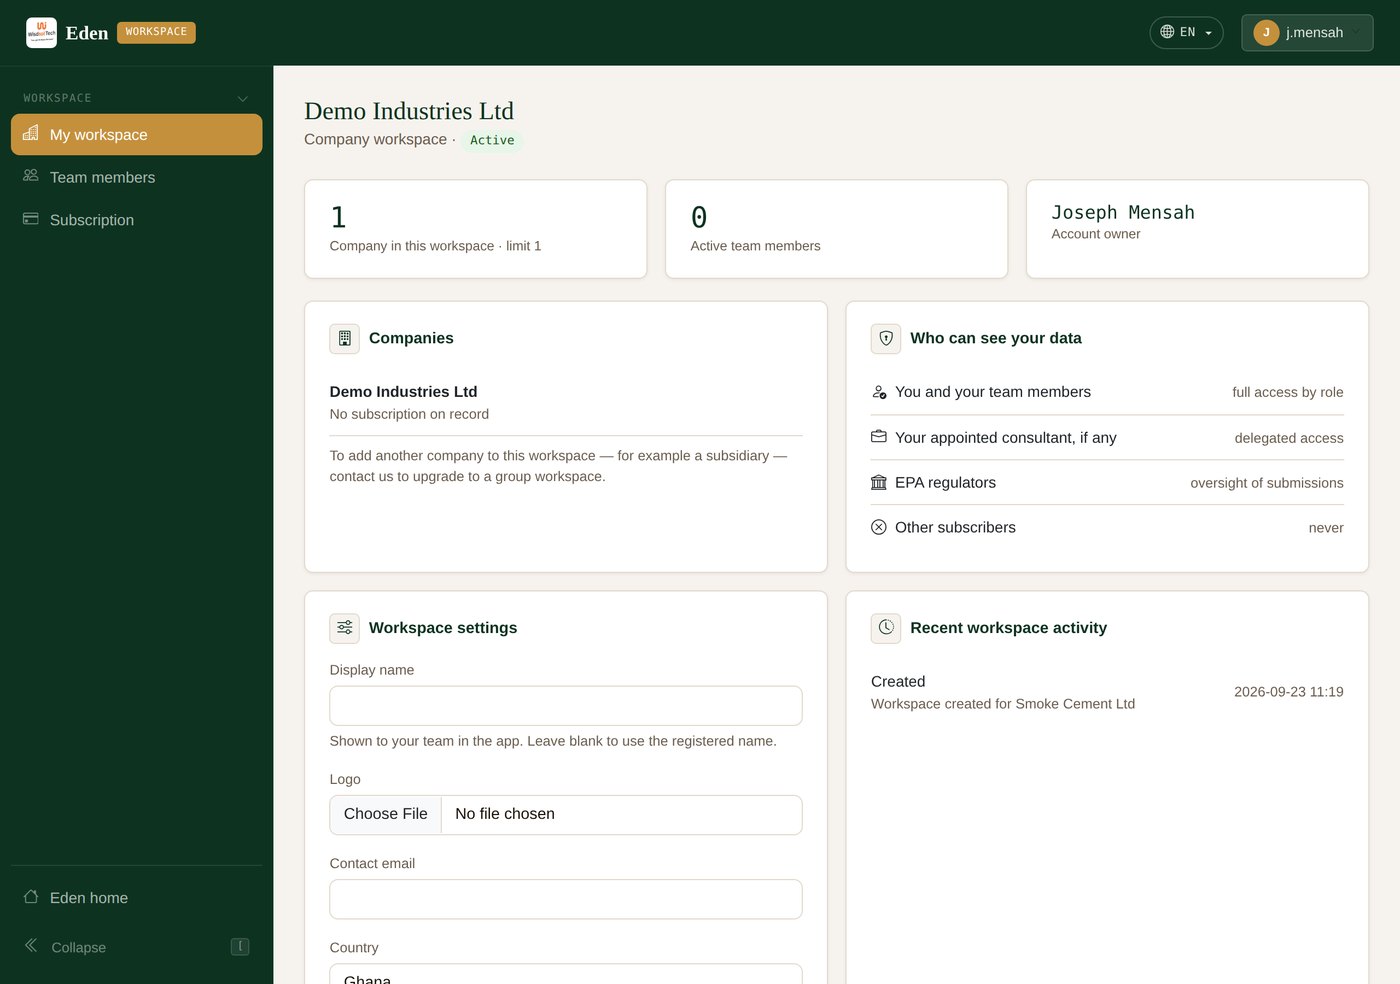
Open My workspace from the user menu (top-right). It shows the companies in your workspace, each company's plan and user seats, your team size, and exactly who can see your data. Account owners can also set a display name, logo and contact email for the workspace.
- Company groups — a group (for example a parent and its subsidiaries) can hold several companies in one workspace. The group's owner sees every company in it; each subsidiary keeps its own login and subscription. Ask Eden support to set up a group.
- More than one workspace — if you belong to several (for example your own company and a consultant firm you work for), switch between them on the workspace page.
Language & region
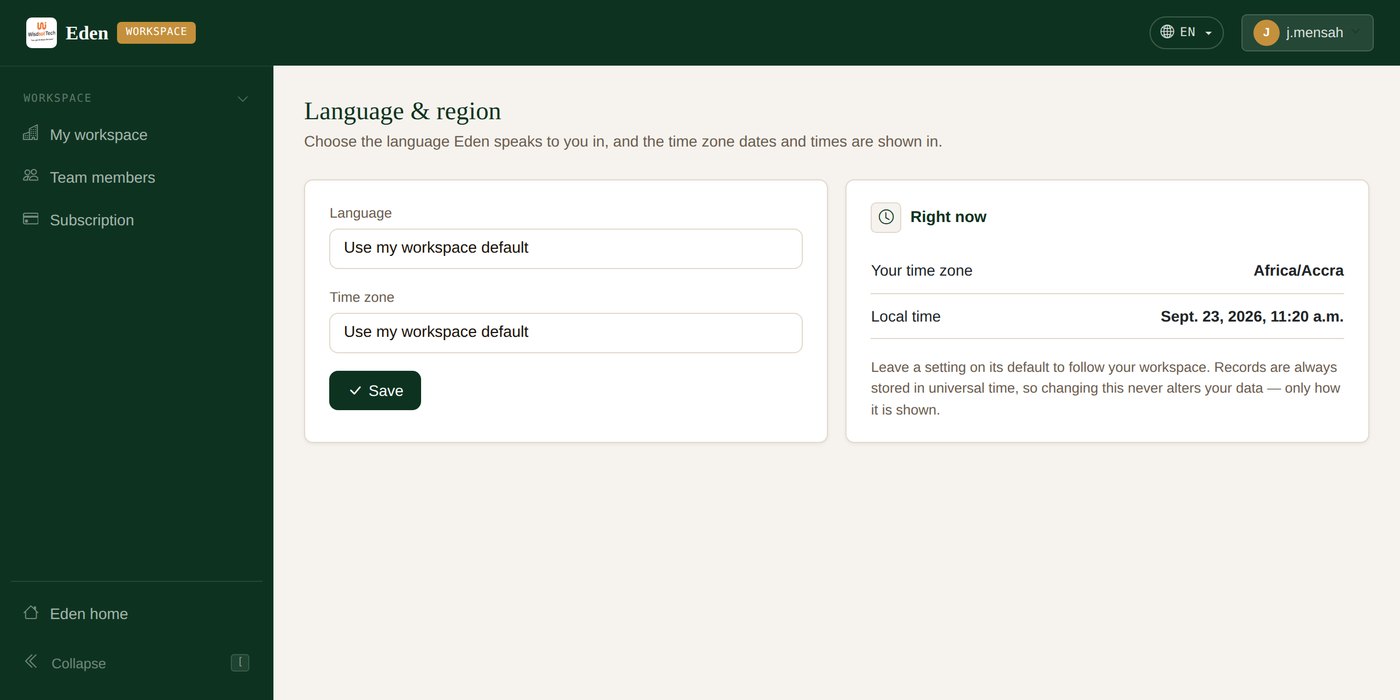
Choose Language & region in the user menu to set the language Eden speaks to you in and the time zone your dates and times are shown in. Your choice follows your account to any device. Leave a setting on its default to follow your workspace.
Eden is available in eight languages:
| Language | Code | Notes |
|---|---|---|
| English | en | The language every string is written in first. |
| Français | fr | |
| Español | es | |
| Português | pt | |
| العربية | ar | Right-to-left layout, applied automatically. |
| Kiswahili | sw | |
| 简体中文 | zh-hans | Simplified Chinese. A browser or saved setting of zh, zh-CN or zh-SG resolves here. |
| Русский | ru |
zh-TW or zh-HK falls back to English rather than being served Simplified, because it is a different script and not a regional variant. Adding a zh_Hant catalogue is what would support it.
Anything not yet translated in a language appears in English, so a partly translated interface is always readable rather than blank. Run python manage.py i18n_report for coverage per language, and python manage.py i18n_audit to check that every catalogue is safe to serve — that its placeholders survived translation, its markup is intact, and it carries the right number of plural forms for the language.
Company Setup Company
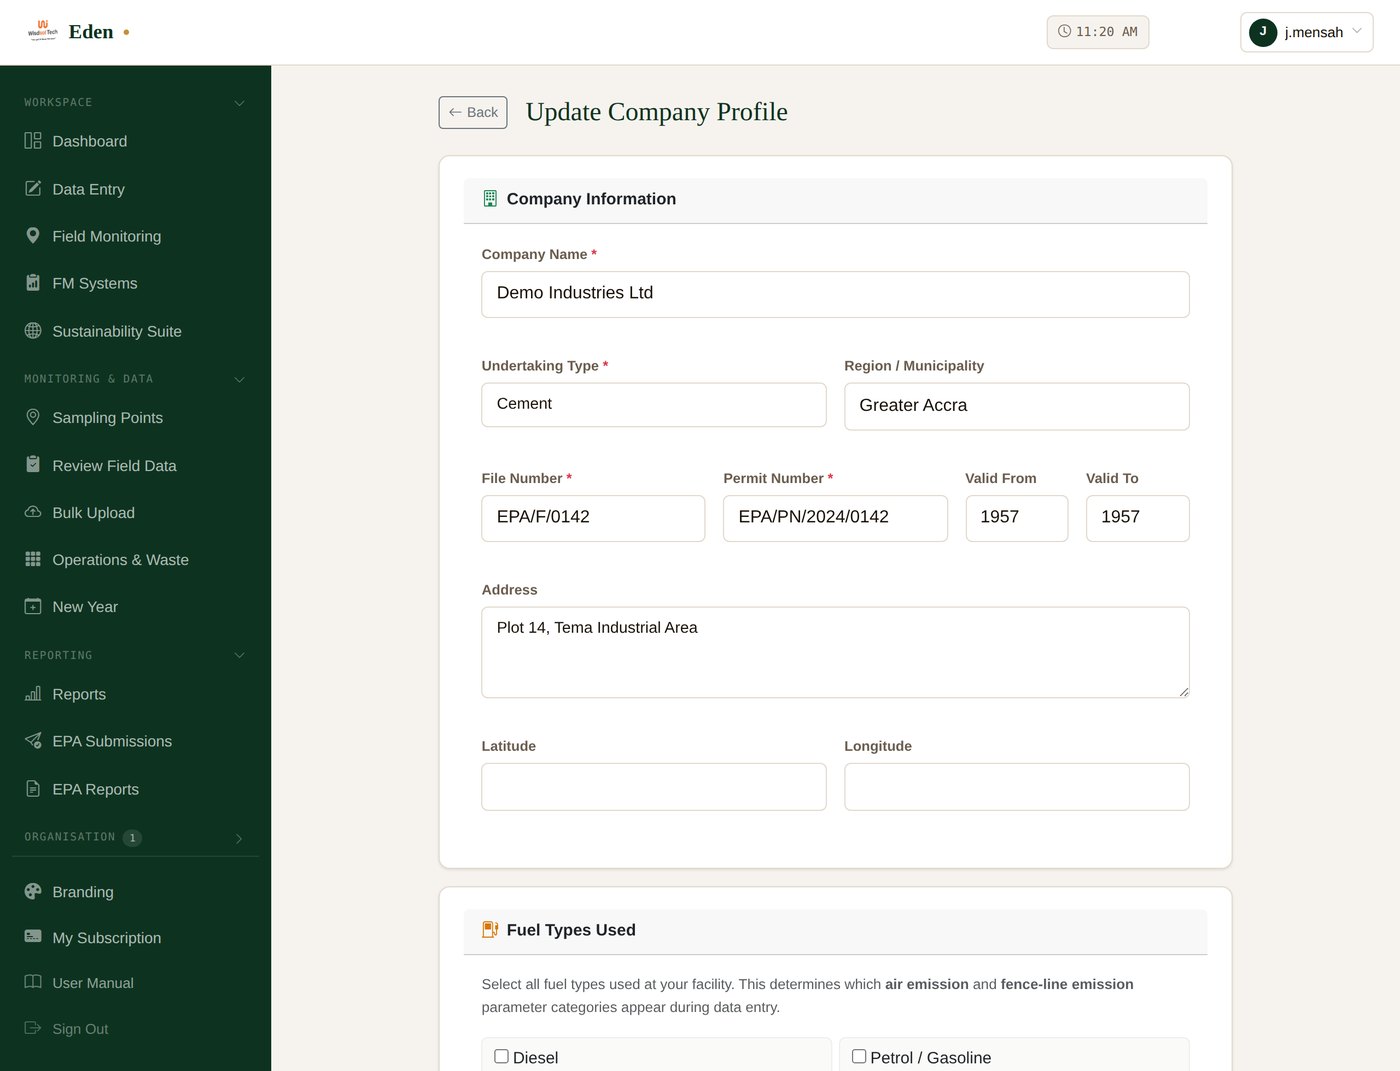
Before you can enter data, your company profile must be complete and at least one Monitoring Year created.
Creating Your Monitoring Year
- Open the dashboardClick "Dashboard" in the sidebar.
- Look for the year selectorIf you see "No monitoring year configured", click "Create Monitoring Year" to start.
- Pick the yearEnter the calendar year (e.g. 2026). Most companies create the current year and the next one ahead.
- SaveYou'll be redirected back to the dashboard with the new year selected.
Company Branding Company
Customise how your company appears on every PDF report Eden generates.
Uploading Your Logo
- Sidebar → Branding.
- Under Company Logo, click Choose File and select your logo image.
- Click Save Logo.
Square format (400×400 px) works best. PNG with transparent background looks cleanest in report headers and certificate spines. The logo will appear in:
- Cover pages of all PDF reports
- Running headers (top of every report page)
- Environmental Performance Certificates
Uploading a Cover Image
Upload a wide hero image (16:9, recommended 1600×900 px) of your facility. This image appears as the front-page background on comprehensive reports. Pick something representative — a photo of your plant, operations area, or facility from the outside.
Removing Images
Click the small Remove button below any uploaded image to delete it. Reports will fall back to a default Eden-branded cover.
Subscription & Payments Company
Manage your subscription plan and payments via Mobile Money.
Viewing Your Subscription
Sidebar → My Subscription. The hero panel shows your current plan, status, and days remaining.
Choosing or Upgrading a Plan
- Browse Available PlansEach plan card shows price (GHS), duration, max users, and features. Featured plans have a "POPULAR" ribbon.
- Click a plan cardThis reveals the payment form below. Your current plan is disabled and cannot be re-selected.
- Pay via Mobile MoneyThe page shows the EPA-Eden MoMo number, account name, and merchant ID. Send the exact amount.
- Fill payment detailsYour MoMo number, the account name on your phone, the transaction reference from your SMS confirmation, and the amount paid.
- Upload payment proofA screenshot of the MoMo SMS confirmation. This is required.
- Submit for ReviewAdmin reviews your payment proof and approves the plan upgrade. You'll see the new plan activate on your subscription page.
Pending Requests
While a request is awaiting admin review, you cannot submit another. The page shows a clear amber banner with a timestamp.
History
The bottom of the page shows your last 10 subscription requests with status pills, amounts, transaction references, and any review notes from admin.
If a Request Is Rejected
The reviewer's notes will explain why (e.g. proof unclear, wrong amount, transaction unverifiable). You can submit a new request with corrected details.
Entering Monitoring Data Company
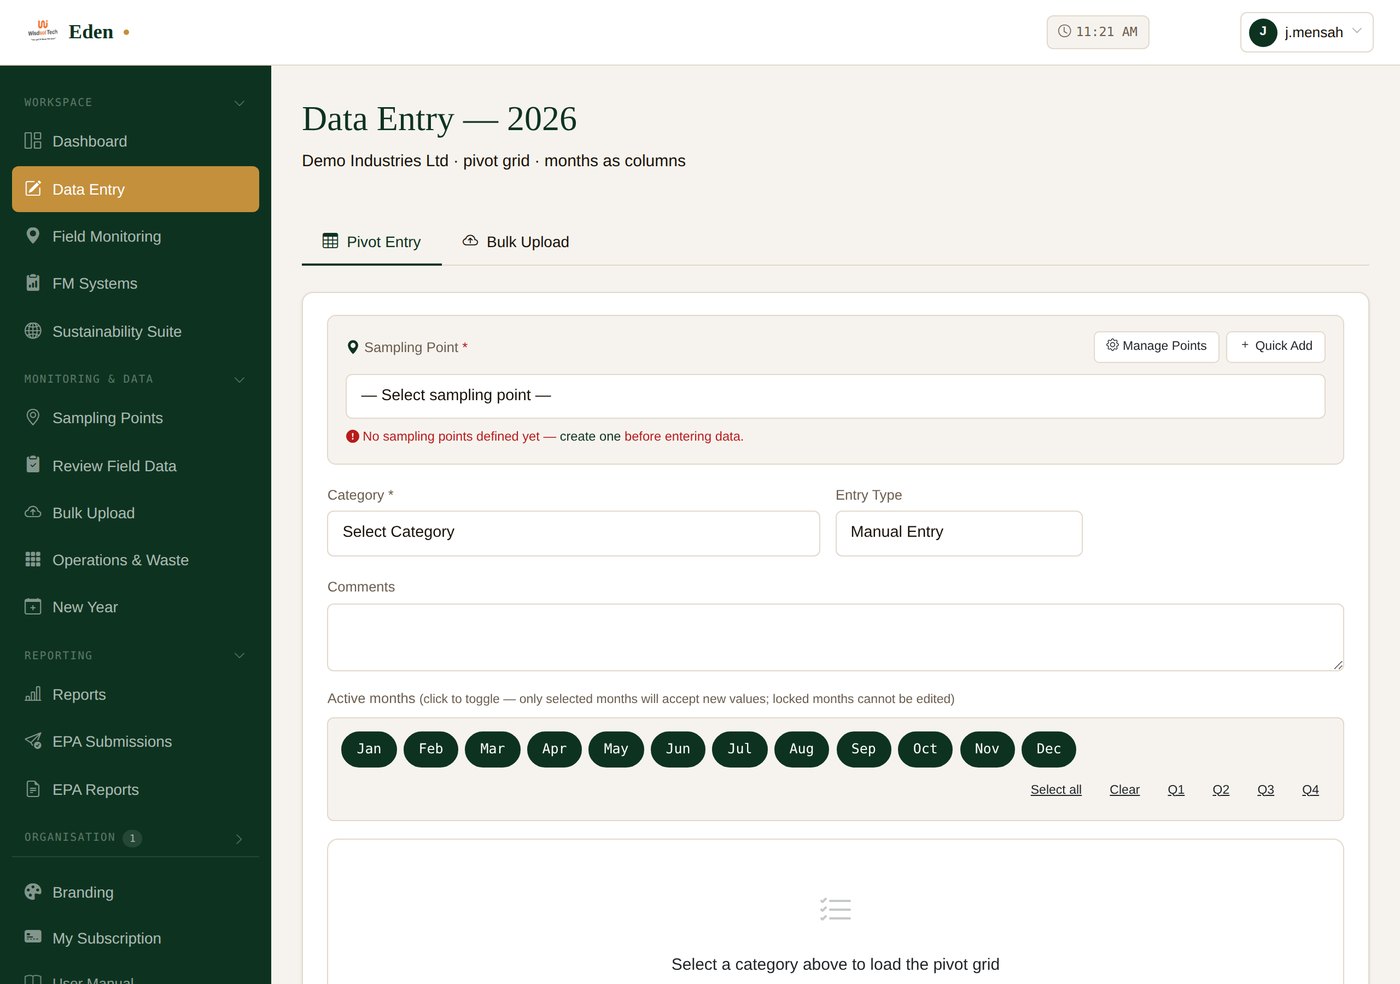
Eden's Data Entry page uses a pivot grid: parameters are rows, all 12 months are columns. You can fill in many cells at once and save them all in one click.
The Pivot Grid Workflow
- Sidebar → Data EntryOr use the "Enter Data" button on the dashboard welcome bar.
- Select a Categorye.g. "Air Quality", "Effluent Discharge". The grid loads with all parameters in that category.
- Pick which months are activeThe month chips at the top let you toggle months. Use Q1/Q2/Q3/Q4 quick buttons or "Select all".
- Type values into cellsUse Tab to move right, Shift+Tab to move left, arrow keys to navigate up/down. Cells over the maximum limit highlight red automatically.
- Add a custom parameter (optional)Click "Add custom parameter" to define a new measurement on the fly — name, unit, and optional min/max limits.
- Click Save EntriesOr press Ctrl/Cmd+S. Existing values turn green to indicate they're saved.
⌨ Keyboard shortcuts on the data entry page
Ctrl+S/⌘+S— Save all entriesTab/Shift+Tab— Next / previous cell↑ ↓ ← →— Navigate between cellsEnter— Move to the next row
Sampling Points Company
Before entering monitoring data, define the locations where measurements are taken. Eden organises these into three categories, each with a distinct purpose:
Why It Matters
The same parameter can have different readings at different points. For example, pH at Outfall A and pH at Outfall B in the same month are stored as separate readings. This unlocks proper multi-point monitoring required by most permits.
Defining a Sampling Point
- Open Sampling Points from the sidebar.
- Enter a clear name (e.g. "Outfall A", "Stack 1", "Boundary North").
- Pick the category — make sure permit-required points are marked Compliance.
- Optionally add description and GPS coordinates for traceability.
- Click Add Sampling Point.
You can also add points on the fly from the data entry page using the Quick Add button — handy when you discover a new location mid-entry.
Editing & Deleting
If a sampling point has measurements attached, deleting it will disable it instead (preserves data integrity). Disabled points won't appear in the data entry picker but historical data remains.
Operations & Waste Data (Sections C, D, E) Company
The AER-1 Annual Report has three sections that need monthly quantified data:
| Section | Topic | Examples of what to record |
|---|---|---|
| C | Operations & Production | Production volume, operating days, raw materials used, fuel consumption |
| D | Waste Generation & Management | Solid waste, hazardous waste, recycled material, disposal routes |
| E | Incidents & Compliance | Spill incidents, complaints, violations, corrective actions |
Where to enter this data
Sidebar → Operations & Waste (or the "Edit monthly data" link inside the EPA Annual Report form). Each section opens as an accordion containing one or more sub-categories. Each sub-category is a pivot grid like the standard data entry page.
EPA Submissions Company
Submissions are formal reports you send to EPA on a fixed schedule. Eden supports four submission cadences:
- Monthly — covers a single month
- Quarterly — covers Q1, Q2, Q3 or Q4
- Termly — covers a 4-month term (1, 2, or 3)
- Annual — covers the full year
Creating a Submission
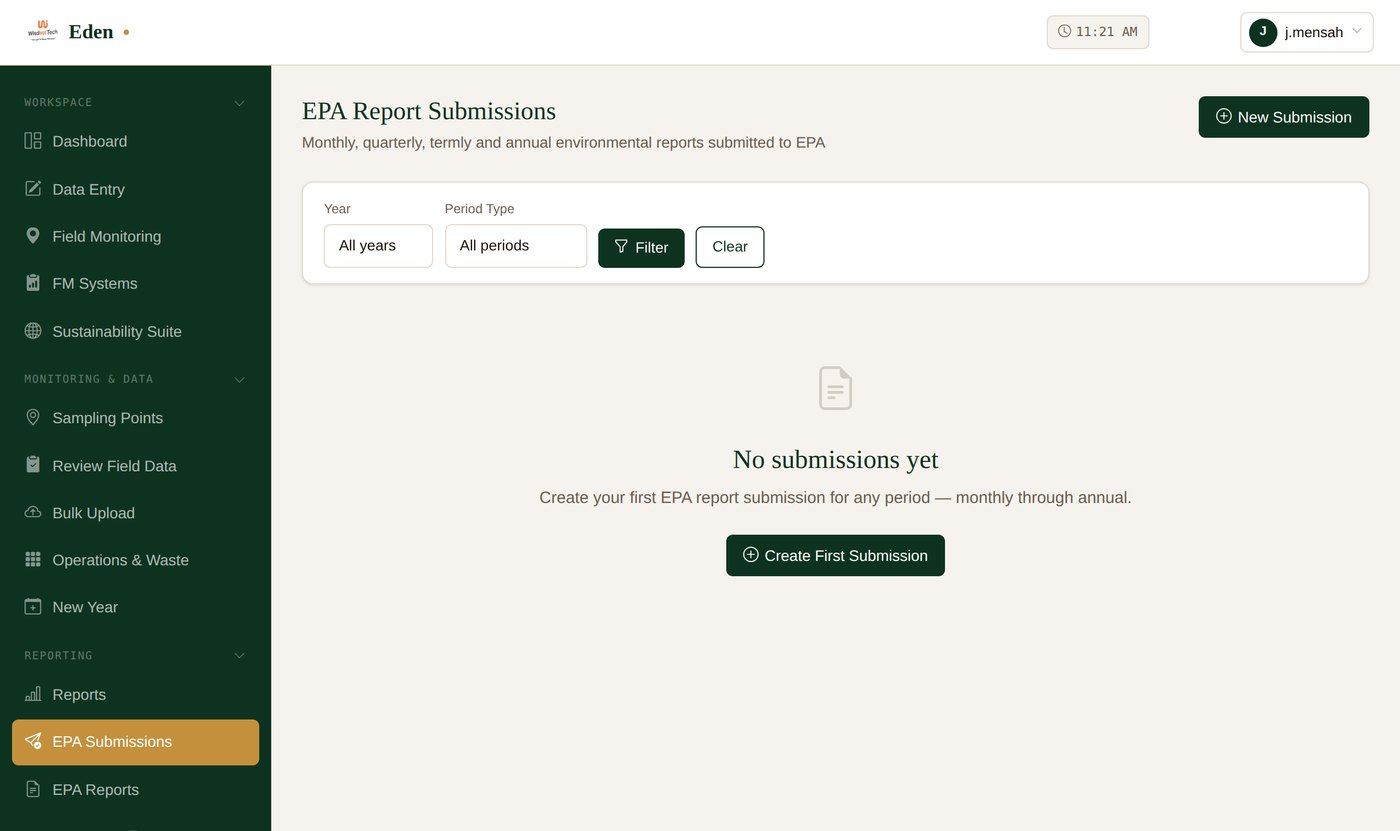
- Sidebar → EPA SubmissionsYou'll see a list of existing submissions and a "New Submission" button.
- Pick the period typeMonthly, Quarterly, Termly, or Annual — and the specific period within it.
- Review the auto-compiled dataEden pulls all your monitoring data for the selected period into the submission. Verify it looks complete.
- Add notesOptional comments for the EPA reviewer (e.g. explaining a missed reading or attaching a brief narrative).
- Save as Draft, then SubmitDrafts can be edited; once submitted, only EPA staff can change the status. You'll get a Reference Number on submission.
Submission Statuses
| Status | What it means |
|---|---|
| Draft | Not yet submitted. Editable and deletable. |
| Submitted | Sent to EPA. Awaiting review. |
| Under Review | EPA staff is currently reviewing. |
| Accepted | Approved. A reference number is assigned. |
| Rejected | Returned with reviewer comments. You may resubmit after fixing the issues. |
Printing a Submission
Open any submission and click Print Receipt. The browser's print dialog opens automatically. Use "Save as PDF" to keep a digital copy for your records. Submitted reports include a professional cover page with your company logo and a running header/footer with company name, submission type, and period.
Data Lock After Submission Company
What Gets Locked
When you submit a Monthly, Quarterly, Half-yearly, Termly, or Annual report, all the monitoring data covering those months becomes read-only for you. Specifically: any submission with status Submitted, Under Review, or Accepted locks the underlying months.
What This Looks Like
- The data entry page shows an amber lock banner at the top listing locked months.
- Locked month chips display a 🔒 icon and cannot be selected.
- If you somehow try to save a value for a locked month, the system rejects it with a clear error.
- The submission detail page shows a "Data Locked" notice.
Who Can Edit Locked Data
Only EPA staff and admins can modify locked data, and only after review with proper justification/proof. If you discover a genuine error after submission, contact EPA to request a correction.
Rejected Submissions
If EPA rejects a submission, the underlying data is automatically unlocked so you can correct and resubmit. Read the reviewer's notes carefully before editing.
Annual Environmental Report (FORM AER-1) Company
The AER-1 is the comprehensive annual return required in Ghana, and the form Eden ships with. Eden auto-fills most of it from data you have already entered. Other countries call their annual return something else and want it laid out differently; the data behind it is the same, and your regulator will tell you which form it expects.
Building the Report
- Sidebar → EPA Reports → New ReportPick the monitoring year. If a draft already exists, you'll be redirected to edit it.
- Section A — Facility & Permit InfoAuto-filled from your company profile. Adjust if needed (e.g. report period, total employees).
- Section B — Contact PersonName, phone, and email of the person responsible for environmental compliance.
- Sections C, D, E — Live Pivot TablesYour monthly quantified data is shown here automatically. To edit: click "Edit monthly data" — it opens the Operations & Waste page in a new tab.
- Section F — CertificationName, designation, and signature date of the person attesting to the report's accuracy.
- Save DraftThe report is now in your reports list. Open it any time to update or print.
- Print as PDFFrom the report detail page, click "Print PDF". A landscape A4 layout with all 6 sections opens in a new tab and the print dialog appears automatically.
Reading Your Dashboard Company
The company dashboard summarises your environmental compliance at a glance.
Compliance Ring
The percentage and color show how many of your monitored values fell within permit limits across all categories for the selected year.
Performance Bars
Each bar represents a category (Air, Water, Noise, etc.) and shows the average compliance percentage for that category.
Recent Data Entries
The latest 10 readings you've entered, with green/red dots showing whether each was compliant.
Year Selector
Switch the dashboard's view to a different monitoring year using the dropdown near the top.
What the ring is actually counting
The compliance ring is readings within limit, divided by readings recorded — for the year you have selected. Two things follow from that, and both surprise people:
- A month you never sampled does not count against you. A ring at 100% with two months of data is not a good year; it is an incomplete one. Read the ring next to the data completeness figure, never on its own.
- A parameter with no limit recorded is never counted as a failure, because nothing judges it. If a category looks suspiciously perfect, that is the first thing to check.
What to do with what you see
| What you see | What it usually means | What to do |
|---|---|---|
| A category bar well below the others | A recurring exceedance, not a one-off | Open that category's data and look along the months, not at a single reading |
| The ring drops when you change year | Last year was worse, or this year is not finished | Compare the completeness figures before concluding anything |
| A red dot in recent entries | That reading was above or below its permitted level | Check it was entered correctly before treating it as an exceedance — a decimal place is the commonest cause |
| Everything empty | No monitoring year has been created, or none selected | Create the year, then the months, then enter data |
The Colour Grade
Every company on Eden carries one colour for each reporting year. It is the single figure a regulator quotes, a bank asks for and a buyer checks, and it appears on the evaluation register, on your certificate and at the top of every report. This chapter explains what it means and how it is arrived at.
Best to worst. Gold, green and blue are compliant. Orange and red are not.
What each band means
| Band | Grade | What it says about the year |
|---|---|---|
| Gold | A+ | Every indicator at its best. No exceedance recorded, nothing outstanding. |
| Green | A | Compliant throughout, with minor room for improvement on at least one indicator. |
| Blue | B | Compliant. Several indicators have improvement opportunities. |
| Orange | C | Below the compliance band. Corrective action is required. |
| Red | D | Non-compliant. Immediate corrective action is required. |
The colour is the worst of eight, not an average
Eden grades eight indicators separately, each getting its own colour, and the company takes the lowest of the eight.
| Indicator | As Eden labels it | Where the score comes from |
|---|---|---|
| Legal and administrative compliance | Legal and administrative compliance | Audit |
| Hazardous and toxic waste management | Hazardous and toxic waste Management | Audit |
| Compliance rate, toxic discharge | Compliance Rate toxic discharge | Monitoring readings, or the audit section where no toxic parameter is monitored |
| Compliance rate, non-toxic discharge and noise | Compliance Rate non toxic discharge and noise pollution | Monitoring readings |
| Monitoring and reporting rate | Monitoring and reporting rate | How much of what was due has been filed |
| Best practice environmental management | Best practice Environmental managements | Audit |
| Complaint management | Complaint managements | Audit |
| Corporate social responsibility | Corporate social responsibility | Audit |
One toxic exceedance grades red
The rule works from the readings, not from an officer's opinion, and it overrides everything else. Which parameters count as toxic is set by your regulator on the parameter record; heavy metals, cyanide and arsenic typically do, while dust, BOD and noise are ordinary banded parameters. Your regulator can tell you which parameters they have marked toxic for your sector.
The same colour everywhere
The band on your certificate, on the evaluation register, on the full report and on the comprehensive report is one and the same figure. If they ever disagree, that is a fault worth reporting — they are all reading the same evaluation.
The supporting breakdown
Beneath the band, each document shows three supporting figures, each on its own 0–100 scale: your compliance rate (readings within their permitted limits), your data completeness (entries filed against entries due so far this year) and your audit result. Together they produce the weighted score shown beside the band.
They are supporting analysis, not the rating — the rating is the band, and the band is the worst of the eight indicators above. Improving a supporting figure without lifting the lowest indicator moves the score and not the colour. Where a company has not been audited at all, the audit part is set aside rather than counted as zero: not having been audited is not the same as having failed an audit.
How to move up a band
Because the band is the floor, there is only ever one thing to fix: the lowest indicator. Open your evaluation report and read down the eight — the one matching your overall colour is the one holding you there. Improving anything else changes the score and not the band.
- Find the indicator at your colourOn the evaluation report, or in the Holding the rating list on your certificate.
- Check whether it is data or auditA monitoring indicator moves when the readings or the filing record move. An audit indicator moves only at the next audit.
- Deal with any toxic exceedance firstWhile one stands, no other improvement can lift you above red.
- File the outstanding returnsThe monitoring and reporting rate is the indicator companies most often overlook, and the easiest to fix.
Certificates & Performance Records
Eden issues one document per company per year, and which document it is follows the colour grade. Open it from Companies → Certificate, or from the certificates list, which shows every company's band for the year before you open anything.
| Band | Document | Reads | Class |
|---|---|---|---|
| Gold | Certificate | Excellence | Platinum |
| Green | Certificate | Merit | Gold |
| Blue | Certificate | Compliance | Silver |
| Orange | Performance record | Improvement required | Provisional |
| Red | Performance record | Non-compliance | Withheld |
What is on the document
- The band, in its colour, as the border, the badge and the verdict panel.
- The issuing regulator — the agency for the company's own country, named in the signature block and the footer.
- A document number carrying the band, so the paper cannot be separated from the rating it was issued against:
ENV-CERT-0014-2026-GOLD, orENV-REC-0004-2026-REDfor a withheld one. - Achievements on an award; the indicators holding the rating down on any document where they exist.
- The supporting breakdown — compliance, completeness and audit, as described in The Colour Grade.
When to issue it
Issue after the year's submissions have been accepted, not before. A document generated mid-year reflects a partial record — the completeness figure is calculated against the months elapsed, so it will read plausibly and still describe an unfinished year. The document carries the date it was produced and is valid for twelve months from issue.
The Sustainability Suite & Action Board Company
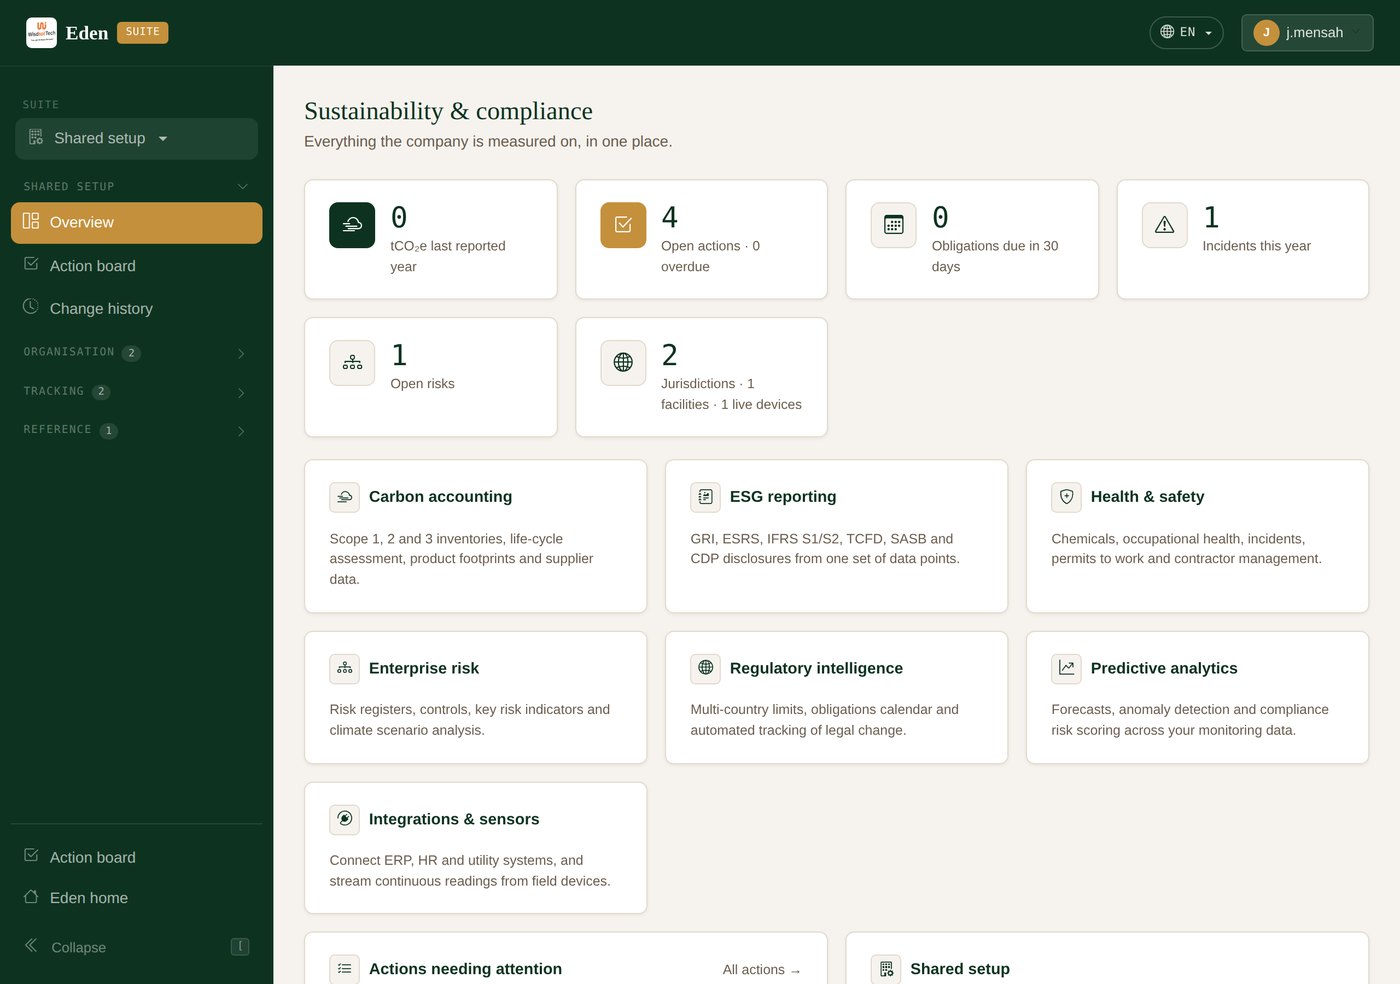
Open Sustainability Suite from the sidebar. The suite extends Eden beyond EPA compliance, using the same data you already record. Switch between its areas with the selector at the top of the suite sidebar:
| Area | What it is for |
|---|---|
| Places & indicators | Your sites and areas on a map, the shared indicator library, and observations with their evidence and checks |
| Compliance | Limits, permits and obligation calendars for every country you operate in |
| Carbon | Greenhouse-gas inventories, reduction targets, product footprints and suppliers |
| ESG | Sustainability reports for GRI, ESRS, IFRS S1/S2, TCFD, SASB, CDP and more |
| Health & safety | Incidents, chemicals, occupational health, contractors and permits to work |
| Risk | Risk registers, controls, key risk indicators and climate risk |
| Analytics | Forecasts, anomaly checks and your compliance risk score |
| Integrations | Sensors, site gateways and connections to other systems |
Start with your facilities
Under Shared setup → Facilities, add each site and choose its country. Every limit, obligation and sensor reading is matched to the right rules through the facility.
The Action Board
Anything that needs doing — a limit exceedance, an incident investigation, an overdue obligation, a risk treatment, an early warning — becomes an action on one shared Action Board. Filter by status or source, assign an owner and due date, and mark actions done when complete.
Places, Indicators & Evidence Company Regulator
Eden records where environmental work happens and what was measured there in one shared way, so the same reading can serve a permit, a report to a donor and a research study without being typed three times. It is the foundation the wider Eden modules (biodiversity, climate, water and others) build on.
Open Sustainability Suite and choose Places & indicators from the switcher at the top of the sidebar. Its pages are:
| Page | What it is for |
|---|---|
| Overview | Your places on a map, the values waiting to be checked, and what was recorded most recently. |
| Map | Every place you can see, with the latest value of any indicator laid over it. |
| Places | Sites, stations, habitats, protected areas, watersheds — anything with a location. |
| Observations | Every value recorded, and how far each one has been checked. |
| Indicator library | What can be measured, with its unit and method, plus your methods and data sources. |
| Modules | Which parts of Eden your organisation uses. |
Every value carries its provenance
A number is only as useful as the answers to the questions somebody relying on it will ask. Eden keeps seven answers with every observation and shows them as a row of links at the top of the observation, ticked when present and marked with a dash when missing:
- Source — where it came from: a survey team, a station, a laboratory, a published dataset.
- Date — when it was observed.
- Location — the place, or an exact GPS position.
- Method — how it was measured, ideally a named standard.
- Evidence — a certificate, photo or field sheet that backs it up.
- Validator — somebody other than the person who recorded it, who has checked it.
- Confidence — how sure that person is: low, medium or high.
Who sees what
Every place, observation, method and data source belongs to one organisation — your company's workspace, or for regulators, your agency — and you choose who else may see it:
| Choice | Who can see it |
|---|---|
| Only my organisation | Your own team. This is the default. |
| My organisation and the regulator of the country it's in | Also that one country's regulator. EPA Ghana sees what a Ghanaian site shares with the regulator; NESREA does not. |
| Everyone on Eden | Every signed-in user of the platform. |
The country a record belongs to is taken from your organisation's country, so a share always reaches the right regulator. A regulator who can see a company's record can read it but never change it, and the same holds the other way round.
Adding and Managing Places Company Regulator
A place is anywhere you measure, protect, restore or regulate. Open Places and click Add a place.
About the place
- Name and your reference — a station ID, permit number or plot code of your own.
- What it is — the kind of place (see the table below). It decides the colour on the map.
- Sits inside — another place it belongs to: a sampling point inside a facility, a plot inside a forest.
- Company and facility — link it to the company and facility the rest of Eden already knows. If you work for one company only, it is chosen for you.
- Boundary comes from — the data source the outline was taken from, such as a government protected-areas dataset.
- Who may see it — see Places, Indicators & Evidence.
| Kinds of place |
|---|
| Site or premises · Facility or installation · Monitoring station · Sampling point · Survey plot or quadrat · Survey transect · Habitat or ecosystem patch · Protected area · Key Biodiversity Area · Forest · Wetland · Mangrove · Coral reef or seagrass · Coastal stretch · Watershed or catchment · River, lake or reservoir · Borehole or well · Waste site or dumpsite · Restoration area · Project area · Community or settlement · Administrative area · Hazard zone · Other |
Where it is: three ways
- Draw it on the map. Use the tools on the left of the map: a marker for a station, a line for a river reach or transect, a polygon or rectangle for an area. Drawn shapes can be edited or deleted with the same tools, and Clear the shape removes them all.
- Type a latitude and longitude for a single point, in decimal degrees — for example 5.6037 and -0.1870. Latitude runs north–south (−90 to 90), longitude east–west (−180 to 180).
- Upload a boundary you already have: GeoJSON, KML, or a shapefile zipped together with its .shp, .shx, .dbf and .prj files, up to 8 MB. Boundaries in another coordinate system, such as UTM, are converted automatically. An upload replaces anything drawn.
Eden works out the area in hectares and, for lines, the length in kilometres from the shape itself. Areas are calculated on the true shape of the Earth, so they match a survey rather than a flat map.
The place page
Each place shows its map, its details, the observations recorded there, and two lists of what it contains: places recorded as inside it (through Sits inside) and places lying within its boundary. The second list is worked out from the shapes themselves, so a monitoring station inside a wetland appears there even if nobody linked them.
Retiring a place
A place with observations recorded against it cannot be deleted, because those values would lose their location. Edit it and untick In use instead: it leaves your lists and forms, and everything recorded there is kept.
Recording and Checking Observations Company Regulator
An observation is one measured value: a PM2.5 reading, a rainfall total, a count of birds, a seedling survival rate. Click Record an observation, or Record here on a place page to have the place filled in.
What, where and when
- What was measured — an indicator from the library. Its unit is fixed by the indicator, and copied onto the value when it is recorded, so changing the indicator later never re-labels old values.
- Value — a number. A count must be a whole number of zero or more, and a percentage must be between 0 and 100. Indicators with a list of allowed answers use Answer instead.
- Where — the place. For an exact position inside it, add a GPS latitude and longitude, or press Use this device's position on a phone in the field. Eden shows how accurate the reading is.
- When — the date and time observed. For a total or an average over a period, also give the date the period ends. A time in the future is refused.
- Method and source — how it was measured and where it came from. If the indicator has a usual method, it is filled in for you.
Automatic checks
Every value is checked as it is saved. Nothing is refused by these checks — a real flood or heatwave produces real extremes, and they must be recordable — but a value that trips one is marked Flagged for review, with the reason shown on the observation:
- it is outside the indicator's plausible range — a PM2.5 of 31,000 µg/m³ is a typing slip, not a finding;
- it has no location, so it cannot be mapped or compared with neighbouring sites;
- its GPS position lies outside the place it was recorded against;
- it is the same value as the last several readings at that place, which often means a row copied from the one above.
Attaching evidence
After saving, attach what backs the value up on the observation page: a laboratory certificate, a photo, a field sheet, or a link. Files up to 15 MB are accepted in these formats: PDF, JPG, PNG, WEBP, HEIC, CSV, XLSX, XLS, DOCX, TXT, JSON, GeoJSON, KML, ZIP and MP4.
Eden records a fingerprint of each file. While the file is the one that was attached, it shows Unchanged; if it is ever replaced, it shows File changed since attached. Evidence can be downloaded only by people allowed to see the observation.
Validating a value
Under Check this value, somebody in the organisation that owns the value chooses one of:
| Action | What it needs | Who |
|---|---|---|
| Validate | How confident you are — low, medium or high | Anyone in the organisation except the person who recorded it |
| Reject | A note saying why | Anyone in the organisation — the recorder too, to withdraw a value entered by mistake |
| Flag for review | A note saying why | Anyone in the organisation, including the recorder |
| Reopen | — | Anyone in the organisation |
Editing a value that has been validated sends it back to be checked again — the validation was of the old value, not the new one. It returns as Not yet checked, or as Flagged for review if the automatic checks find something in the new value. Rejected values stay on record but never appear on the map.
The History at the bottom of each observation lists every step — recorded, flagged by the automatic checks, validated, rejected, edited — with who did it and when. It cannot be edited.
Values waiting for a check are listed on the Overview under Waiting to be checked.
The Indicator Library Company Regulator
The Indicator library holds the definitions everybody measures against, so two teams recording "PM2.5" record the same thing in the same unit. It has three tabs: Indicators, Methods and Data sources.
The shared Eden library
Entries marked Eden library are maintained by Wisdsol and available to every organisation: 38 indicators covering air, water, soil, noise, climate, biodiversity, forests, coasts, waste and energy, and 17 standard methods such as ISO 7027-1 for turbidity and EN 12341 for particulate matter. They cannot be edited by an organisation.
An indicator, field by field
- Code — a short, stable key such as
pm25ortree-survival. Your codes must be unique within your organisation. - Domain, unit and value type — a measured number, a count, a percentage, a category or yes/no. A category indicator needs its list of allowed answers.
- Direction — whether lower or higher is better, a range to stay within, or neither. It decides how the map colours values.
- Definition — exactly what is measured, so two teams measure the same thing.
- Plausible range — what an instrument can read and nature can produce. Values outside it are flagged for review, not refused.
- Reports to — the frameworks the indicator feeds, one per line, written as
FRAMEWORK: code, for exampleSDG: 6.3.2orGRI: 303-4.
Adding your own
Click Add your own on any tab. What you add belongs to your organisation and is visible to whoever you choose, like any other record. Methods name a standard or protocol and how it is applied. Data sources record who operates or publishes the data, a link, the licence it may be used under, and how to cite it.
The Map Company Regulator
The Map page shows every place you are allowed to see, coloured by kind: protected areas and forests in greens, water bodies and wetlands in blues, monitoring stations in purple, hazard zones in red. Click a place for its name, kind and area, and a link to its page.
- Every kind of place narrows the map to one kind.
- The second list, which starts at No values — places only, lays the most recent value of the indicator you choose over the map, one dot per place.
Values are coloured from green to red following the indicator's own direction: where lower is better, red is high; where higher is better, red is low. Indicators with no direction are shown in a single colour, because a colour would imply a judgement nobody has made. Rejected values are never shown.
The map uses OpenStreetMap, so it needs an internet connection; the shapes and values themselves come from Eden.
Choosing Your Modules Company Regulator
Eden is one platform with many modules. The Modules page lists all of them, grouped by family — Eden Core, Compliance, Climate, Biodiversity, Research, Monitor, GIS, Projects, ESG, Finance and Intelligence — and shows which your organisation uses.
| Shown as | Meaning |
|---|---|
| Always on | Places, indicators & evidence; Shared setup; and Regulatory intelligence. Everything else depends on them. |
| On / Off | Field & laboratory monitoring, Carbon accounting, Enterprise & climate risk, ESG reporting, Health & safety, Predictive analytics, and Integrations & sensors. All are on until your organisation switches one off. |
| Off until switched on | The 19 modules that start switched off: Biodiversity & ecosystems, Land, soil & forests, Marine & coastal, Natural capital & ecosystem services, Climate indicators & research, Physical climate risk, Adaptation planning, Impact assessment (EIA / SEA), Waste & circular economy, Water resources, Satellite & remote sensing, Early warning & alerts, Community & citizen reports, Projects, MEL & results, Climate & environmental finance, Carbon & nature markets, Research portal, Open data hub and Environmental assistant. Each is described in the chapters that follow; an administrator switches on the ones your organisation needs. |
Switching a module on or off
Click Switch off or Switch on beside the module. Only an administrator can: the owner of a company's workspace or an organisation admin of a company in it, and for a regulator, the agency administrator. Everyone else sees the page read-only.
- A module switched off disappears from the menu for everyone in your organisation, and its pages send people to the Modules page with a note saying it is off.
- Nothing is deleted. Switching it back on brings everything back exactly as it was.
- The choice is your organisation's alone. It changes nothing for anybody else, including your regulator.
Working in the Eden Modules Company Regulator
The 19 modules that start switched off — from biodiversity to the environmental assistant — all work the same way, so what you learn in one carries over to the rest. Once an administrator switches a module on (see Choosing Your Modules), it appears in the switcher at the top of the sidebar.
The screens every module has
| Screen | What it does |
|---|---|
| Overview | The module's headline numbers, the tables that need attention, how many records of each kind you hold, and a map of everything in the module that has a location. |
| A list for each kind of record | Search, filters, and Download CSV — the CSV holds exactly the rows the list shows you, with the filters applied. |
| The record's page | Its details; a Worked out box with what Eden calculates from it; the records filed under it; its location on a map; and Next steps — buttons such as Confirm, Close the manifest or Publish to the open data hub. |
| Add / Edit | One form. Records with a shape — a patch of deforestation, a detected change, a citizen report — have a map to draw on, a latitude and longitude to type, or a boundary file to upload. |
Records filed under another
Some records only exist as part of another: a sighting belongs to a survey, a disbursement to a grant, a mitigation measure to an impact. Add them from the parent's page, with the + Add link beside the table. They always take the parent's owner and its Who may see it choice: share a survey with the regulator and its sightings go with it; make it private again and they follow. You can only file a record under a parent your organisation owns.
Who sees what
Exactly as for places and observations: Only my organisation, My organisation and the regulator of the country it's in, or Everyone on Eden. Every list, map, dropdown, export, dashboard number and answer from the assistant is cut to what you may see. A record you may not see does not exist as far as Eden is concerned: its address answers "not found".
A record that other records still depend on — a species with sightings, a waste stream with manifests — cannot be deleted; Eden says so and leaves it in place.
Biodiversity, Land, Marine & Natural Capital Company Regulator
Biodiversity & ecosystems
Add a Survey (where, when, the method and the effort in person-hours), then the Sightings made during it: the species and how many individuals. Choose species from the Species list, which records each one's IUCN Red List status, any national protection, and whether it is invasive or endemic. A survey's page works out:
- Species recorded (richness) and individuals counted.
- Shannon H′ = −Σ pᵢ ln pᵢ, where pᵢ is each species' share of the individuals — higher means more species, more evenly represented.
- Simpson's 1−D — the chance that two individuals picked at random are of different species.
- Evenness (Pielou J′) = H′ ÷ ln(species).
- Threatened species (Vulnerable, Endangered or Critically endangered) and invasive species recorded, and individuals per person-hour.
With no individuals there is no index — Eden shows a dash rather than a misleading zero. Habitat condition records an assessment of a place: good, fair, poor or severely degraded, with an optional 0–100 score and the threats seen.
Land, soil & forests
Loss & degradation records deforestation, degradation, soil loss or conversion, with its cause. Draw the area on the map and Eden measures it in hectares the same way it measures places. A new record is Detected; from its page mark it Verified on the ground, a False alarm (with the reason), and later Action taken.
Restoration projects hold their Plantings and Survival checks. A survival check counts a sample of seedlings and how many are alive; the project's page shows the latest survival rate and the estimated number still alive — planted × the latest survival rate. It is an estimate, and labelled as one.
Marine & coastal
- Shoreline — each coastal segment is measured from a fixed benchmark seaward to the shoreline. From two measurements at least a year apart Eden draws a least-squares line through them all and reports the change in metres a year: eroding when the distance shrinks.
- Reefs & seagrass — live coral cover, the share of it bleached, and seagrass cover, each 0–100%.
- Blue carbon — area × your carbon density gives tonnes of carbon, and × 44/12 tonnes of CO₂. Eden supplies no default density: published values differ several-fold between sites, so you enter your own and its source.
- Fisheries — landings by site and species; with the effort in vessel-days, the catch per unit effort.
Natural capital & ecosystem services
Record the Natural assets you rely on — a forest, a wetland, an aquifer — and the Ecosystem services each provides, grouped as provisioning, regulating, cultural and supporting. A service may carry a value a year, but only with the method used (market price, replacement cost, avoided damage, benefit transfer or a stated-preference survey). Values in different currencies are shown side by side and never added together. Dependencies & impacts screens what your activities depend on, or do to, nature, rated from very low to very high.
Climate Indicators, Risk & Adaptation Company Regulator
Climate indicators & research
A climate indicator names an indicator from your library (rainfall, maximum temperature…) and a place, and a baseline period such as 1991–2020. Eden works everything out from the observations already recorded there — no second copy of the data:
- the baseline: the average of the yearly values in the baseline years (each year's average, or its total for rainfall-type indicators);
- the latest year and its difference from the baseline;
- the trend per decade, a least-squares line through the yearly values. It needs readings in at least three years.
Rejected values are left out. A climate indicator shared more widely than private only uses readings shared at least as widely, so a public figure is never built from private data. Projections keep what downscaled climate projections say — the variable, the scenario (SSP1-2.6 to SSP5-8.5), the horizon, the central change and its range — and the source it came from. Eden does not run climate models.
Physical climate risk
Record each Hazard — flood, drought, extreme heat, sea-level rise and others — for today or a future scenario, with its level from 1 to 5. A Risk assessment scores a place against a hazard:
Risk = hazard × exposure × vulnerability, each 1–5, so from 1 to 125.
| Score | Band |
|---|---|
| 1–12 | Low |
| 13–36 | Medium |
| 37–64 | High |
| 65–125 | Very high |
Adaptation planning
An Adaptation plan holds its Actions. Start an action from the Options library (mangrove restoration, early-warning systems, rainwater harvesting, cool roofs and others), link it to the risk it reduces, and give its cost and the losses it avoids in the same currency. Eden works out the benefit–cost ratio — above 1, an action pays for itself — ranks actions by it, and shows the plan's progress as the average of its actions, leaving out dropped ones.
Impact Assessment, Waste, Water & Remote Sensing Company Regulator
Impact assessment (EIA / SEA)
An assessment moves through eight stages: Screening, Scoping, Baseline studies, Impact assessment, Review, Decision, Monitoring and compliance, and Closed. Press Move to the next stage on its page; Eden refuses, and says why, until the stage's work is on file:
| To leave | Eden needs |
|---|---|
| Screening | The screening category. Category C needs no assessment and goes straight to Closed. |
| Scoping | At least one impact identified. |
| Baseline studies | A summary of what they found. |
| Impact assessment | Every impact rated; a mitigation measure for every moderate or major negative impact; at least one public consultation. |
| Decision | The decision. Approved with conditions needs the conditions; a refused project can only be closed. |
| Monitoring | Every condition complied with. |
Each impact is rated by magnitude × sensitivity of the receptor, each 1–4: 2 or less is negligible, 4 or less minor, 8 or less moderate, above 8 major. A decision can only be recorded at the Decision stage. Tick Strategic assessment (SEA) for a policy, plan or programme.
Waste & circular economy
A Manifest follows one consignment from dispatch to the facility that took it. When the facility's weight is recorded the manifest is Received; if it differs from the dispatched weight by more than 5% it is flagged, and it cannot be closed without saying why. Hazardous waste cannot be sent to a facility not recorded as accepting it, and a closed manifest can no longer be changed. The overview shows the share of waste kept out of disposal — reused, recycled, composted or burnt for energy — and facility licences expiring within 90 days.
Water resources
Record abstraction and discharge Licences with the volume each allows per day, month or year, and the water actually withdrawn or discharged over each period. Eden compares the volume with what the licence allows for the same number of days — over 100% is flagged — and refuses a discharge booked against an abstraction licence. Water stress divides a catchment's total demand by its renewable supply and bands it as WRI Aqueduct does: under 10% low, 10–20% low to medium, 20–40% medium to high, 40–80% high, 80% and over extremely high. Water quality readings are observations in Places & indicators.
Satellite & remote sensing
The Image catalogue lists the satellite and drone images you work from. A Detected change — forest loss, a burn scar, a flood extent, new mining — is drawn on the map, measured in hectares, and must be Confirmed or marked a False positive by somebody other than the person who drew it. Redrawing a confirmed change sends it back to be checked. Eden does not process imagery itself.
Early Warning & Citizen Reports Company Regulator
Early warning & alerts
An Alert rule says what to watch for:
- A reading crosses a threshold — checked the moment a reading is recorded or edited. Leave the place empty to watch every place.
- Readings stop arriving — no reading of an indicator at a place for a number of days.
- A permit or licence is about to expire — permits in Regulatory intelligence, water licences and waste facility licences.
The last two are checked once a day. A rule only ever sees your own organisation's readings — and, for a regulator, readings companies in its country have shared with the regulator. Each thing raises an alert once.
Under Who is told, add people by email, SMS or WhatsApp, each with the lowest severity they want (information, warning or danger). The alert carries the rule's advice. Every delivery is listed on the alert: Sent, Failed, or Not sent — channel not set up on this server when SMS and WhatsApp have not been connected; email is unaffected. From the alert's page, Acknowledge it and mark it Resolved.
Community & citizen reports Regulator
Members of the public report pollution, spills, dumping, fires, tree cutting, illegal mining, industrial accidents and other problems through Eden Report, the public app at /report/ — no account needed. It works in any phone browser and can be installed on the home screen like an app. In three short steps they choose their country and what is happening (ticking Someone is in danger if it is urgent), mark the place on the map or tap Use where I am, and describe it, with a photo if they have one. Only countries whose regulator has switched this module on are offered, and each report belongs to that regulator from the moment it arrives.
- The reporter gets a tracking code to follow it under Follow (/report/track/), which shows the status and your public reply — never your internal notes or the reporter's contact details. The codes sent from a phone are listed under My reports on that phone only; nothing on the server links a report to a phone.
- Your agency's contact email is told the moment a report arrives. When the reporter says someone is in danger, the subject starts with [URGENT], the report is flagged Urgent in the list (filter on it), and the module page counts urgent reports still open.
- No signal? The report — photo included — is kept on the phone and sent automatically when the connection returns.
- Photos must be JPEG, PNG or WebP and at most 5 MB. Eden re-saves them, which removes the location data a phone stores inside a photo.
- At most 5 reports an hour are accepted from one connection, and robots are turned away. The old addresses (/eden/report/) still work and lead to the app.
Work a report from its page: Start looking into it, then Confirmed or Could not be confirmed (with a note), Action taken, and Close.
The app also has Get help, for questions to the Eden team about the platform itself — those go to Wisdsol Tech's support, not to you, and are listed for platform staff in the administration area under Contact messages, with the contact page's messages.
Projects, Finance & Carbon Markets Company Regulator
Projects, MEL & results
A Project holds its logframe — Results at the impact, outcome, output and activity levels, each contributing to one above it — and each result its indicators with a baseline and a target. Add Measurements as they come in. Progress is how far the latest value has moved from the baseline towards the target, so it works for a reduction (cases down from 200 to 50) as well as an increase. The project's page also shows its milestones, budget lines and money spent, and funding opportunities that may fit it.
Climate & environmental finance
Keep the Funders you work with and their Opportunities: themes, the countries they are open to, amounts and deadline. Eden suggests opportunities for each project that is still open: a shared theme, the project's country (or a call open to all countries), and a deadline not yet passed. It is a suggestion, not an eligibility check. Follow Applications from idea to award, and record Grants and the Disbursements actually received — never more in total than the grant.
Carbon & nature markets
A Credit project — carbon, biodiversity, water or other nature units, under Verra, Gold Standard, Plan Vivo, Article 6 or a national registry — holds:
- Monitoring periods — baseline emissions, project emissions and leakage. Net reductions less the buffer pool contribution, rounded down to whole units, is what the period can support.
- Issuances — only against a verified period, and never more than it supports. The vintage must fall within the period.
- Retirements & transfers — never more than the balance of that vintage. The check is made again at the moment of saving, so two people retiring the last credits at once cannot both succeed.
The project's page shows issued, retired and the balance, vintage by vintage.
Research, Open Data & the Assistant Company Regulator
Research portal
Record Research projects, their Datasets and Publications. Each dataset keeps its Versions: a data file of up to 50 MB (CSV, spreadsheets, JSON and GeoJSON, GeoPackage, KML, NetCDF, GeoTIFF, Parquet, PDF or a zip of them) fingerprinted with SHA-256 so anyone can confirm a copy is unaltered. A version keeps its file; a correction is a new version. A Review must be written by somebody other than the person who filed the dataset or the version.
Open data hub
Press Publish to the open data hub on a dataset's page. Eden publishes it only if your organisation has the Open data hub switched on, the dataset is shared with Everyone on Eden under an open licence, and it has at least one version. Published datasets appear in the public catalogue at /eden/data/ and in the read-only API at /eden/api/v1/datasets/, with their licence, citation and checksums. Withdraw from the hub takes one down; switching the module off takes them all down at once.
Without a key the API returns published datasets only, up to 120 requests an hour. An API key from this module also returns your organisation's own unpublished datasets — never anybody else's — up to 2,000 requests an hour. Press Issue a new key and copy it straight away: Eden keeps only a fingerprint and cannot show it again.
Environmental assistant
Ask in plain words: What expires in the next 60 days?, Which places have the highest climate risk?, What is waiting to be checked?, Latest PM2.5 at Tema station, Trend of rainfall at Kumasi, What is overdue?, Carbon credit balance, and similar questions about species, alerts, survival rates and forest loss.
The assistant is not a chatbot that guesses. Each answer is worked out exactly from records you are allowed to open, in modules your organisation has switched on, and says what it was worked out from. A question it does not recognise gets a plain I can't answer that and a list of what it can.
Multi-Country Compliance Company
The compliance module answers one question well: which limit governs this measurement? A company operating in three countries is subject to three sets of law at once, and the answer differs by country, by sector, sometimes by the zone a plant sits in and the time of day. The module resolves that, keeps your permits and deadlines, and tracks changes in the law.
Telling Eden where you operate
Open Company Profile → Where you operate, or Compliance → Operating in. Add each country, with the local entity name and registration number if they differ from the parent company. One country is the main one; it fills your workspace country, which in turn suggests language, time zone and currency.
How Eden chooses the limit that applies
A single parameter can have several limits: your own internal standard, a national limit, a sector-specific limit and an international guideline. Eden resolves them in a fixed order, and always shows which one it used and why.
| Rank | Source | Beats |
|---|---|---|
| 1 | Your own internal standard, marked as overriding | Everything below |
| 2 | The most specific jurisdiction — a district beats its country, which beats a regional bloc | Broader jurisdictions |
| 3 | Within one jurisdiction, the most narrowly scoped limit — sector or undertaking specific | General limits |
| 4 | Binding statutory limits | Advisory guidelines (WHO, IFC) |
Use Limit finder to check any parameter before you rely on it. Type the parameter, pick the medium and facility, and Eden shows the value, its source and the reasoning. A blank field on a limit means applies to all, so a limit with no sector set applies to every sector.
Internal standards
Under Compliance → Company standards you can set a limit tighter than the law requires — common practice for operators who want a margin before a statutory breach. A standard can apply company-wide or to one facility. Mark it overriding only if it should replace the statutory limit in compliance checks; otherwise it is recorded as an internal target alongside the legal one.
Permits
Record every permit with its number, issuing authority, issue and expiry dates, and its conditions. Set renewal lead days to however long your authority takes to process a renewal — Eden raises the renewal action that many days before expiry, not on the expiry date itself.
The compliance calendar
An obligation is something you must do repeatedly: a quarterly report, an annual return, a monitoring round. Give it a frequency and a first due date, and Eden generates dated instances forward from there.
- Create the obligationTitle, frequency, first due date, the facility it applies to and who owns it.
- Set the lead timeHow many days before the due date the work should start. The action appears then.
- Work the calendarEach instance is open, done or overdue. Marking one done rolls the next one forward.
Overdue obligations feed the compliance risk score, so an ignored calendar shows up in your risk figure rather than staying invisible.
Regulatory changes
Regulatory changes lists new and amended rules matched to the countries and sectors you operate in. Each one is recorded with a status: not yet assessed, assessed as relevant, or not applicable. Recording why a change does not apply to you is as valuable as acting on one that does — it is the evidence an auditor asks for.
The exceedance register
Every measurement Eden checks against a limit is recorded here, whether it passed or failed, with the limit used and its source. Exceedances are what a regulator asks about, and the register is your record of how each was identified and handled.
Carbon Accounting — Scope 1, 2 and 3 Company
Carbon accounting measures the greenhouse gases your company is responsible for, in tonnes of CO₂ equivalent (tCO₂e). Eden follows the GHG Protocol Corporate Standard, which divides emissions into three scopes.
| Scope | What it covers | Typical examples |
|---|---|---|
| Scope 1 | Fuel you burn yourself, and gases you release directly | Kiln and boiler fuel, site vehicles and plant, refrigerant leaks, generators |
| Scope 2 | Energy you buy and consume | Purchased electricity, purchased steam, heating and cooling |
| Scope 3 | Everything else in your value chain, up and downstream | Purchased goods, business travel, employee commuting, waste, freight, use of sold products |
Scope 1 and 2 are normally required first because you control them directly. Scope 3 is usually the largest, and the hardest to measure, because it depends on data from other companies.
Building an inventory
- Create the inventoryOne per reporting year, with its start and end dates. State the consolidation approach — operational control is the most common — and describe what is in and out of the boundary.
- Define emission sourcesEach thing that emits: a kiln, a vehicle fleet, an electricity supply. Give it a scope, a category and the facility it belongs to.
- Enter activity dataWhat was consumed, in its natural unit: litres of diesel, kWh of electricity, tonnes of waste. Enter it per quarter or per month — smaller periods make errors easier to find.
- CalculateEden multiplies each activity by the right emission factor and totals by scope.
- Review and submitCheck the result, then submit to lock the inventory so figures cannot shift under a report that cites them.
Emission factors
A factor converts an activity into emissions — for example kilograms of CO₂e per litre of diesel. Eden picks the factor by activity key, jurisdiction, year and scope, preferring one that matches your unit exactly.
Scope 2: two numbers, both correct
Scope 2 is calculated twice, because the GHG Protocol requires both:
- Location-based uses the average emissions of the grid you are physically connected to. It reflects the grid as it actually is.
- Market-based reflects the electricity you contractually bought — a green tariff or renewable certificates lower this figure. Record those certificates under Energy attribute certificates for them to count.
Report both. A market-based figure alone, with no location-based number beside it, looks like an attempt to hide the grid.
Reduction targets
A target states how much you will cut, from which base year, by when. Eden supports absolute targets (total tonnes down by X%) and intensity targets (tonnes per unit of production or revenue). It plots your trajectory against the required path so you can see drift early.
Product footprints and life-cycle studies
A product carbon footprint is the emissions of one product per declared unit — a tonne of cement, a litre of product. Build it from components, each with its own quantity and factor. A life-cycle study goes further, covering defined stages from raw materials to end of life, and can report impacts beyond carbon.
Supply chain and Scope 3
Register suppliers with their country, category, criticality and annual spend. For each, record whether they have a code of conduct and whether they report GHG data. Where a supplier gives you real figures, use them; where they do not, Eden estimates from spend. The supply chain page scores suppliers so you can see where to push for real data first.
ESG Reporting and the Frameworks Company
ESG stands for environmental, social and governance — the three areas investors, lenders and large customers ask about. ESG reporting goes beyond permit compliance: it asks what your company does about climate, people and how it is run.
Several bodies publish frameworks saying what to disclose. Most companies must satisfy more than one. Eden holds one set of figures and maps it onto each framework, so you answer once.
The frameworks Eden supports
| Framework | Who it is for | What it asks |
|---|---|---|
| GRI Global Reporting Initiative | The most widely used worldwide; suits any company reporting to a broad audience | Universal disclosures about the organisation, plus topic standards for each material topic |
| ESRS European Sustainability Reporting Standards | Required for companies in scope of the EU CSRD, including some non-EU companies with EU operations | Detailed, mandatory datapoints across environment, social and governance, with double materiality |
| IFRS S1 | Investors; adopted or being adopted by many national regulators | General sustainability-related risks and opportunities that affect company value |
| IFRS S2 | The climate companion to S1 | Climate risks, scenario resilience, Scope 1, 2 and 3 emissions, transition plans |
| TCFD Task Force on Climate-related Financial Disclosures | Widely requested by lenders and investors; now largely folded into IFRS S2 | Four pillars: governance, strategy, risk management, and metrics and targets |
| SASB | Investors looking for industry-specific metrics | A short set of financially material metrics per industry |
| CDP | Companies asked to disclose by investors or large customers | An annual questionnaire on climate, water and forests, scored A to D- |
Eden also carries BRSR, the UN SDG indicators and ISO 14001 mappings.
Materiality — deciding what to report
You are not expected to report everything. A materiality assessment decides which topics matter enough. Eden scores each topic two ways:
- Impact materiality — how much your company affects people and the environment through this topic.
- Financial materiality — how much this topic affects your company's own prospects and value.
Scoring both is double materiality, which ESRS requires. A topic that is material either way goes in the report. Record who you consulted under Stakeholder engagement: an assessment nobody outside the company contributed to is hard to defend.
Producing a report
- Sync your metricsESG → Company metrics → Sync pulls emissions, energy, water, waste, safety rates and compliance figures from the rest of Eden, so nothing is retyped.
- Create the reportGive it a year, a period and the frameworks it must satisfy.
- BuildEden lists every datapoint those frameworks require.
- AutofillDatapoints Eden already knows are filled from your data, with the source recorded.
- Check the gapsThe gaps page lists what is still unanswered. Complete those by hand.
- SubmitLocks the report. Record any external assurance and its level.
Health & Safety Company
The health and safety module covers incidents, the rates calculated from them, chemicals, occupational health, contractors and permits to work.
Reporting an incident
Report everything, including events that hurt nobody. Each incident records what happened, where and when, who was involved, the immediate action taken, and two severities: actual (what did happen) and potential (what could reasonably have happened).
Classifications
| Classification | Meaning |
|---|---|
| Near miss | No injury or damage, but there could have been |
| First aid | Minor treatment only, no further consequence |
| Medical treatment | Treatment beyond first aid |
| Restricted work | The person could work, but not their normal duties |
| Lost time | The person could not work at all for at least one full shift |
| Fatality | A death |
The classification drives the safety rates, so being accurate here matters more than it looks. Incidents marked notifiable remind you to inform the regulator within its deadline.
Safety performance — what the rates mean
Rates let a small site and a large one be compared fairly, by expressing injuries per fixed number of hours worked. Eden calculates four:
| Rate | Formula | What it tells you |
|---|---|---|
| TRIR Total recordable incident rate | recordable injuries × 200,000 ÷ hours worked | Overall injury frequency. 200,000 hours is 100 full-time workers for a year, so TRIR of 2 means roughly 2 recordable injuries per 100 workers per year. |
| DART Days away, restricted or transferred | (lost-time + restricted) × 200,000 ÷ hours | The share of injuries serious enough to change what someone can do. |
| LTIFR Lost time injury frequency rate | lost-time injuries × 1,000,000 ÷ hours | The international (ILO) convention, used across most of Africa, Europe and Asia. |
| Severity rate | days lost × 1,000,000 ÷ hours | Not how often, but how bad — a single serious injury moves this sharply. |
TRIR and DART use 200,000 (the OSHA convention); LTIFR and severity use 1,000,000 (ILO). Never compare a figure on one base with a figure on the other.
Chemicals
Register each substance with its CAS number, hazard classes, hazard and precautionary statements, and signal word. Attach the safety data sheet. Track quantities and locations in the inventory, with segregation notes where substances must not be stored together.
A chemical risk assessment covers a task, not a substance: the same solvent is low risk poured into a beaker in a fume hood and high risk sprayed in a confined space.
Occupational health
A surveillance programme defines who must be examined, for what, and how often — for example annual audiometry for anyone in a high-noise area. Eden tracks who is due. Exposure monitoring records measured exposures and compares them against occupational exposure limits.
Contractors and permits to work
Prequalify contractors before they work on site: insurance, safety record, competencies. Each contractor worker carries an induction date and expiry, and any competencies the job needs.
A permit to work authorises high-risk work — hot work, confined space, work at height, electrical isolation — after the controls are confirmed in place.
Risk Registers and Climate Scenarios Company
A risk register is the list of things that could go wrong, how bad each would be, what you do about it, and who owns it. Eden supports company-wide and facility-level registers.
Scoring a risk
Each risk is scored on two 1–5 scales, and the score is their product (1–25).
| Score | Severity — how bad | Likelihood — how probable |
|---|---|---|
| 1 | Insignificant | Rare |
| 2 | Minor | Unlikely |
| 3 | Moderate | Possible |
| 4 | Major | Likely |
| 5 | Severe | Almost certain |
Score it twice. Inherent is the risk with no controls at all. Residual is what remains with your current controls working. The gap between them is what your controls are actually worth — and if there is no gap, the controls are not doing anything.
Set a target score for where the risk should end up, and a velocity for how fast it would arrive: a slow-moving risk leaves time to react, a fast one does not.
Treatment strategies
- Reduce — add or strengthen controls. The usual answer.
- Avoid — stop doing the activity that creates the risk.
- Transfer — insurance or a contract moves the consequence elsewhere. Note that this rarely transfers regulatory or reputational consequences.
- Accept — live with it, consciously and on record, within your risk appetite.
Controls and testing
A control is what keeps a risk down. Record whether it is preventive (stops the event) or detective (tells you it happened), and whether it is technical, procedural or behavioural. Mark the ones you cannot operate safely without as critical.
A control nobody tests is an assumption. Set a test frequency and record each control test with its evidence. Eden flags overdue tests, and a critical control that fails its test should move the residual score straight away.
Key risk indicators
A KRI is a number watched because it moves before the risk does — exceedances per month, overdue actions, contractor induction lapses. Set a green and an amber threshold and a direction (higher or lower is better); readings are then classified automatically.
Give a KRI a source key and Eden reads it from your own data on a schedule instead of waiting for someone to type it in.
Suggested risks
Suggest risks from data looks across Eden — recurring exceedances, repeated incidents, lapsed contractor approvals, missed obligations — and proposes draft risks a register probably ought to contain. Nothing is opened automatically: review each, keep what fits your business, and discard the rest.
Climate risk and scenarios
Climate risk assessment asks how your business fares under different futures. Eden distinguishes two kinds:
- Physical risk — what the changing climate does to you. Acute events (flood, storm, heatwave) and chronic shifts (rainfall patterns, sea level, sustained heat affecting outdoor work).
- Transition risk — what the response to climate change does to you. Carbon pricing, tighter regulation, changing customer requirements, technology shifts, financing conditions.
The scenarios
A scenario is a plausible future, not a prediction. You test the same business against several. Eden ships the ones reporting frameworks expect:
| Family | Scenarios | What they explore |
|---|---|---|
| IPCC (AR6) | SSP1-2.6, SSP2-4.5, SSP5-8.5 | Physical climate outcomes, from strong mitigation to high emissions |
| NGFS | Orderly transition, Disorderly transition, Hot house world | Built for financial institutions: how policy timing changes the damage |
| IEA | Net Zero by 2050, Announced Pledges, Stated Policies | Energy-system pathways — useful for energy-intensive operations |
For each assessment, record the scenario, the time horizon (short, medium, long), whether the risk is physical or transition, its likely financial effect, and your response. IFRS S2 and TCFD both ask for this, and both ask you to show resilience under more than one scenario.
Predictive Warnings and Anomaly Detection Company
Analytics looks at the monitoring data you already have and answers two questions: where is this heading? and does this reading look wrong?
Forecasts — where a parameter is heading
A forecast model reads one parameter from one source and projects it forward. Eden offers several methods:
| Method | Use it when |
|---|---|
| Linear | The value drifts steadily up or down |
| Holt | There is a trend that itself changes — the usual choice |
| Holt-Winters | There is a repeating seasonal pattern, such as a rainy season |
| Mean | The value is basically flat and you want the normal range |
| EWMA | Recent readings should count more than old ones |
Set the horizon (how many periods ahead) and the minimum points needed before it will run. A model with too little data is skipped and says so, rather than producing a confident line from four readings.
Predictive alerts
When a forecast crosses a limit within the horizon, Eden raises an alert naming the parameter, the limit, and roughly when the breach is expected. The point is to act while it is still cheap: adjust the process, service the equipment, schedule the maintenance — before the exceedance is a matter of record.
Each alert can be turned into an action on the action board, or dismissed with a reason when you know why the trend is happening and it is expected.
Anomaly detection — readings that do not fit
An anomaly is a reading that does not fit the recent pattern. Most anomalies are not pollution events at all, and that is exactly why they matter:
- A faulty or drifting instrument
- A decimal point in the wrong place, or a value entered in the wrong unit
- A sample taken at the wrong place or time
- A genuine process upset — the case worth acting on
The sensitivity setting controls how far from normal a reading must be before it is flagged. Lower it and you catch more real problems along with more noise; raise it and you see only the extremes. Start around 3 and adjust after a month of use.
Review each anomaly and mark it confirmed, explained or a data error. That feedback is what keeps the register useful — an unreviewed anomaly list is quickly ignored.
The compliance risk score
A single 0–100 figure for how much compliance risk the company is carrying, with bands from low to severe. It combines:
- Recent exceedances, and how severe they were
- Parameters forecast to breach
- Overdue compliance obligations
- Overdue corrective actions, weighted by priority
- Notifiable and high-potential incidents
- Gaps in monitoring data — thin data is itself a risk, because compliance cannot be demonstrated
Each factor is capped, so no single input can dominate the score, and every contribution is written out in plain language beneath it.
Sensors and Integrations Company
Integrations bring data into Eden automatically: continuous monitoring devices in the field, and connections to systems you already run.
Devices and channels
A device is a physical instrument — an air quality station, a noise monitor, an effluent probe. Register it with a reference, its type, the facility it sits at, and its position. A channel is one measurement that device produces: one station may report PM2.5, PM10 and NO₂ on three channels.
Each channel maps to a parameter key so Eden knows which limit applies, and carries its unit, a valid range, and optionally a multiplier and offset for calibration correction.
Readings, and what happens to them
As readings arrive Eden stores them with a quality flag, checks them against the limit resolved for that parameter and facility, and marks any exceedance immediately. Readings outside the valid range are flagged rather than silently accepted.
Device health
Set a reporting interval and an offline after period. If nothing arrives within that period the device is marked offline, so a silent instrument is visible rather than looking like clean air.
Calibration and data quality
Record each calibration with its date and result; Eden tracks when the next is due against the device type's interval. Use data quality flags to mark periods when readings should not count — during calibration, a known fault, maintenance, or a power failure. Flagged periods are excluded from reporting, with the reason on record.
Connections to other systems
A connection links Eden to another system — ERP, HR, a utility portal, a laboratory information system. Field mappings say which field there corresponds to which field here. Sync jobs run on a schedule and record what was transferred, so a failed sync is visible rather than silent.
Webhooks let another system push data to Eden as it happens, instead of waiting for a scheduled pull. Each endpoint has its own secret, which can be rotated without disturbing the others.
Working Offline & App Updates
Eden needs an internet connection to load and save your data. This keeps your records accurate and private on shared devices, because no one else's data is ever stored on the phone or tablet.
- If your connection drops, a red bar appears at the top of the screen. Anything you type while it shows will not be sent — wait for it to disappear before saving.
- If you open a page with no connection, Eden shows a You're offline screen. It reloads by itself as soon as the connection returns.
- When a new version of Eden is released, a notice appears: A new version of Eden is ready. Click Reload when convenient — save any open form first.
Keyboard Shortcuts
| Shortcut | Action | Where it works |
|---|---|---|
Ctrl/⌘ + S | Save current form | Data entry, audit, EPA report |
Tab / Shift+Tab | Move to next/previous field | All forms |
↑ ↓ ← → | Navigate cells | Pivot grids |
Enter | Submit / move down | Forms / grids |
Esc | Close modal / cancel | Any modal |
Ctrl/⌘ + P | Open print dialog | Any printable page |
[ | Collapse or expand the sidebar | Every page with a sidebar (not while typing) |
Troubleshooting
"I can't log in"
- Username and password are case-sensitive. Check Caps Lock.
- Use the email link from your welcome message — it auto-fills the username.
- If you've forgotten your password, click "Forgot password?" on the login page or contact your EPA Admin.
"I can't find the Install button"
- It appears only in browsers that can install apps — Chrome, Edge or Samsung Internet on Android and computers, and Safari on iPhone and iPad. Firefox on a computer cannot install apps.
- If Eden is already installed, the button is hidden. Open Eden from your home screen or desktop instead.
- If you closed it with ✕, use Install app in your user menu (top-right). See Installing the Eden App.
"A red bar says I'm offline"
- Your device has lost its connection. Nothing you type while the bar shows will be sent — wait for it to disappear, then save.
- On public Wi-Fi (hotels, airports), you may need to sign in to the Wi-Fi network in your browser first.
"A new team member can't join"
- Your plan's user limit may be reached. The Team Members page shows how many seats are used; upgrade under My Subscription or remove an inactive member.
"My data isn't saving"
- Check your network connection. The save button shows red if there's a network error.
- Ensure you've selected at least one Month chip — values for un-selected months are skipped.
- Look at the bottom-left status indicator — it shows "Saving…", "Saved ✓", or "Error".
"A module has disappeared from my menu"
- Your organisation's administrator has probably switched it off. Open Places & indicators → Modules to see what is on. Switching it back on brings everything back; nothing was deleted. See Choosing Your Modules.
"My boundary file is refused"
- Shapefiles must be zipped together with their .shp, .shx, .dbf and .prj files. Without the .prj, Eden cannot tell which coordinate system the shape is in.
- A shape whose edges cross each other is refused. Fix it in your mapping software, or redraw it in Eden.
- Files are limited to 8 MB. Simplify a very detailed boundary first.
"I can't validate a value"
- Nobody can validate a value they recorded. Ask a colleague in your organisation to do it.
- Choose how confident you are before pressing Validate; it is required.
"My report PDF is blank"
- Make sure you allowed pop-ups for the Eden domain — the PDF opens in a new tab.
- If your browser blocks the auto-print, manually press
Ctrl+P(or⌘+P) once the page has loaded.
"I see permission errors"
- Your role may not allow that action. Check your role badge on the dashboard.
- For EPA staff: verify your sector assignments include the company in question.
- Contact your EPA Administrator if you believe you should have access.
Frequently Asked Questions
Can other companies see my data?
No. Your records are visible only to you, the team members you invite, your appointed consultant, and EPA regulators as part of their oversight. Every page checks who you are before showing a record. See Workspaces, Teams & Data Privacy.
What happens to my data if my workspace is suspended?
Nothing is deleted. You and your team see a notice explaining why instead of your dashboard, and full access returns the moment the workspace is reactivated. EPA regulators keep read access to your compliance records during a suspension.
Do I have to install the app?
No. Eden works the same in any modern browser. Installing just gives you an icon on your home screen or desktop and a full-screen window.
Can I have multiple monitoring years open at once?
Yes. The year selector pills at the top of the dashboard, data entry, and reports pages let you switch between any year that has been created. Historical data is preserved indefinitely.
Will companies see the permit limits I configure?
No. Permit limits (Min/Max columns) are visible only to EPA Admin, Sector Heads, and EPA Staff. Companies see their own values and averages but not the limit thresholds. Compliance is still validated server-side.
How do auditors record an audit if they don't see point scores?
Auditors see the question and the available answer choices (e.g. "Yes — fully compliant", "Partially compliant", "Non-compliant"). The point value behind each answer is hidden from them. An auditor picks the answer that matches what they observed, rather than the one that scores well, which is the whole point.
Can my regulator see my places and observations?
Only the ones you choose to share. Each place and observation is set to Only my organisation, My organisation and the regulator of the country it's in, or Everyone on Eden. A regulator who can see one can read it but never change it. See Places, Indicators & Evidence.
Why was my value flagged when it is correct?
A flag is a request for a second look, not a judgement. Real extremes — a flood, a spill, a heatwave — fall outside the usual range and are flagged so somebody confirms them. Once a colleague validates the value, it stands as recorded.
Can I bulk upload monthly readings?
Yes. On the Data Entry page, switch to the "Bulk Upload" tab. Download the CSV template, fill it in, and upload. The system shows a preview of the first 10 rows before importing.
What's the difference between a Submission and an Annual Report?
A Submission is a periodic report (monthly/quarterly/termly/annual) covering a specific monitoring window. The Annual Report (AER-1) is a comprehensive year-end document that includes operations, waste, and incident data alongside monitoring results. Both are required; submissions are more frequent.
Can I change my username?
No, usernames are permanent. If you need a change, an EPA Admin can deactivate your account and create a new one with the new username.
Can I delete a submitted report?
Drafts can be deleted by you. Once submitted, only EPA Staff can change the status (e.g. reject it back to draft). Accepted submissions become permanent records.
Where do I report a bug?
Use the feedback button or contact support@eden.com.gh. Include your username, what you were trying to do, and a screenshot if possible.
Glossary
| Term | Meaning |
|---|---|
| Action board | One shared list of everything that needs doing across Eden — exceedances, incident actions, overdue obligations, risk treatments. |
| AER-1 | Annual Environmental Report Form 1 — the comprehensive yearly compliance document. |
| Agency | A country's environmental regulator in Eden — NESREA, NEMA, EPA Ghana, IBAMA, CPCB and so on. An agency sees only its own country's companies, and configures only its own country's rules. |
| Anomaly | A reading that does not fit the recent pattern — often a faulty instrument or a typing slip rather than a real change. |
| Audit | Structured EPA staff assessment of a company's environmental practices, with scored questions. |
| Carbon footprint (product) | The greenhouse gases attributable to one product, per declared unit. |
| Category | A grouping of related monitoring parameters (e.g. "Air Emissions" contains NOx, SOx, particulates). |
| CDP, ESRS, GRI, IFRS S1/S2, SASB, TCFD | Sustainability reporting frameworks. Eden maps one set of your figures onto whichever of them you must report against. |
| Colour grade (band) | The one colour a company carries for a reporting year — gold, green, blue, orange or red. It is the worst of eight indicator colours, not a range on a score, and it is the same figure on the register, the certificate and every report. See The Colour Grade. |
| Compliance Rate | Percentage of monitored values that fell within permit limits. |
| Consultant | An environmental firm working on behalf of client companies, with its own team and workspace. |
| Data Completeness | Entries filed against entries due so far. A finished year divides by twelve; the year in progress divides by the months elapsed, so a company that is up to date in March reads 100%, not 17%. |
| Data quality flag | A marked period (calibration, power loss, fault) whose sensor readings are excluded from reporting. |
| ESG | Environmental, social and governance — the wider sustainability reporting that goes beyond permit compliance. |
| Evaluation report | The regulator’s formal assessment for one company and year: eight indicator scores and the overall band. The rating of record — every document reads its colour from here. |
| Evidence | A file or link that backs up an observation — a laboratory certificate, a photo, a field sheet. Eden keeps its fingerprint, so a file swapped after the fact shows as changed. |
| Exceedance | A reading that breached the permit's maximum limit. |
| Exposure limit (OEL) | The maximum concentration of a substance a worker may breathe, averaged over a defined period. |
| Indicator (grading) | One of the eight things a company is graded on. Two come from monitoring readings, six from audit sections. Each takes its own colour, and the lowest becomes the company’s band. |
| Indicator (measured) | Something that can be measured — PM2.5, rainfall, seedling survival — defined once in the indicator library with its unit and method, and recorded as observations. |
| Jurisdiction | A country or region whose environmental rules apply to you. It decides which limits, permits and deadlines Eden uses. |
| KRI | Key risk indicator — a number watched because it moves before the risk does. |
| LTIFR | Lost time injury frequency rate: lost-time injuries × 1,000,000 ÷ hours worked. |
| Materiality | Deciding which sustainability topics matter enough to report — by their effect on the world and on the business. |
| Module | One part of Eden — carbon accounting, health & safety, places & indicators. An organisation’s administrator can switch most of them off; nothing is deleted when they do. |
| Monitoring Year | The annual reporting period (typically calendar year). All data is scoped to a year. |
| Near miss | An event that could have caused injury or damage but did not. Reporting them prevents the real thing. |
| Observation | One measured value of an indicator, at a place and a time, with its source, method, evidence and checks. |
| Parameter | A specific environmental measurement (pH, BOD, lead concentration, noise level…). |
| Performance record | What Eden issues instead of a certificate when a company grades orange or red. It states the assessment, marks the certificate withheld, and lists the indicators responsible. |
| Performance Score | The weighted figure shown beside the band, combining compliance rate, data completeness and audit result. Supporting analysis, not the rating: a company can score 99 and still grade red. |
| Permit Number | The EPA-issued permit identifier for a regulated company. |
| Permit to work | Written authorisation for high-risk work (hot work, confined space, work at height) after the controls are confirmed. |
| Pivot Grid | The data entry layout where parameters are rows and months are columns. |
| Place | Anywhere Eden measures, protects or regulates — a station, a facility, a wetland, a protected area — stored with its real shape. |
| Plausible range | The values an indicator can realistically take. A value outside it is flagged for a person to check. It is not a legal limit. |
| Provenance | The seven answers kept with every observation: source, date, location, method, evidence, validator and confidence. |
| Provisional rating | The band Eden shows before the regulator has issued the evaluation for the year. It is what the record would produce; viewing it never creates a report. |
| PWA | Progressive web app — Eden installed on a phone, tablet or computer, opening in its own window. |
| Scope 1, 2 and 3 | Emissions you burn directly (1), from the energy you buy (2), and across your value chain (3). |
| Sector | A top-level industry classification (Manufacturing, Mining, Energy…). |
| Submission | A periodic report sent to EPA covering a specific period (monthly/quarterly/etc.). |
| Toxic parameter | A parameter the regulator has marked toxic on its record — heavy metals, cyanide, arsenic and the like. A single reading above the limit on one of these grades the whole company red. |
| TRIR | Total recordable incident rate: recordable injuries × 200,000 ÷ hours worked. |
| Undertaking Type | A specific business activity within a sector (e.g. "Cement Production" within "Manufacturing"). |
| User seat | One person who can sign in to your workspace. Your plan sets how many you have. |
| Validation | A second person in the organisation checking an observation and recording how confident they are in it. Nobody can validate a value they recorded. |
| Workspace | Your own private area of Eden. Your data is visible only to your team, your consultant and your regulator. |
Eden Environmental Compliance Platform
Built by Wisdsol Tech. First deployed with the Environmental Protection Agency, Ghana; now serving regulators and industry in several countries.
Version 1.0 · Manual updated October 2026 · Contact Support